
Comparing Europe’s Tax Systems: Property Taxes
Today’s map shows how European OECD countries rank on property taxes, continuing our series on the component rankings of our 2020 International Tax Competitiveness Index (ITCI). Although an important element when measuring the neutrality and competitiveness of a country’s tax code, property taxes account on average for less than 5 percent of total tax revenue in European OECD countries.
The ITCI’s property tax component measures and compares the base and amount of real property taxes and whether a country levies further types of property taxes, such as wealth taxes, estate and inheritance taxes, property transfer taxes, corporate asset taxes, capital duties, and financial transaction taxes.
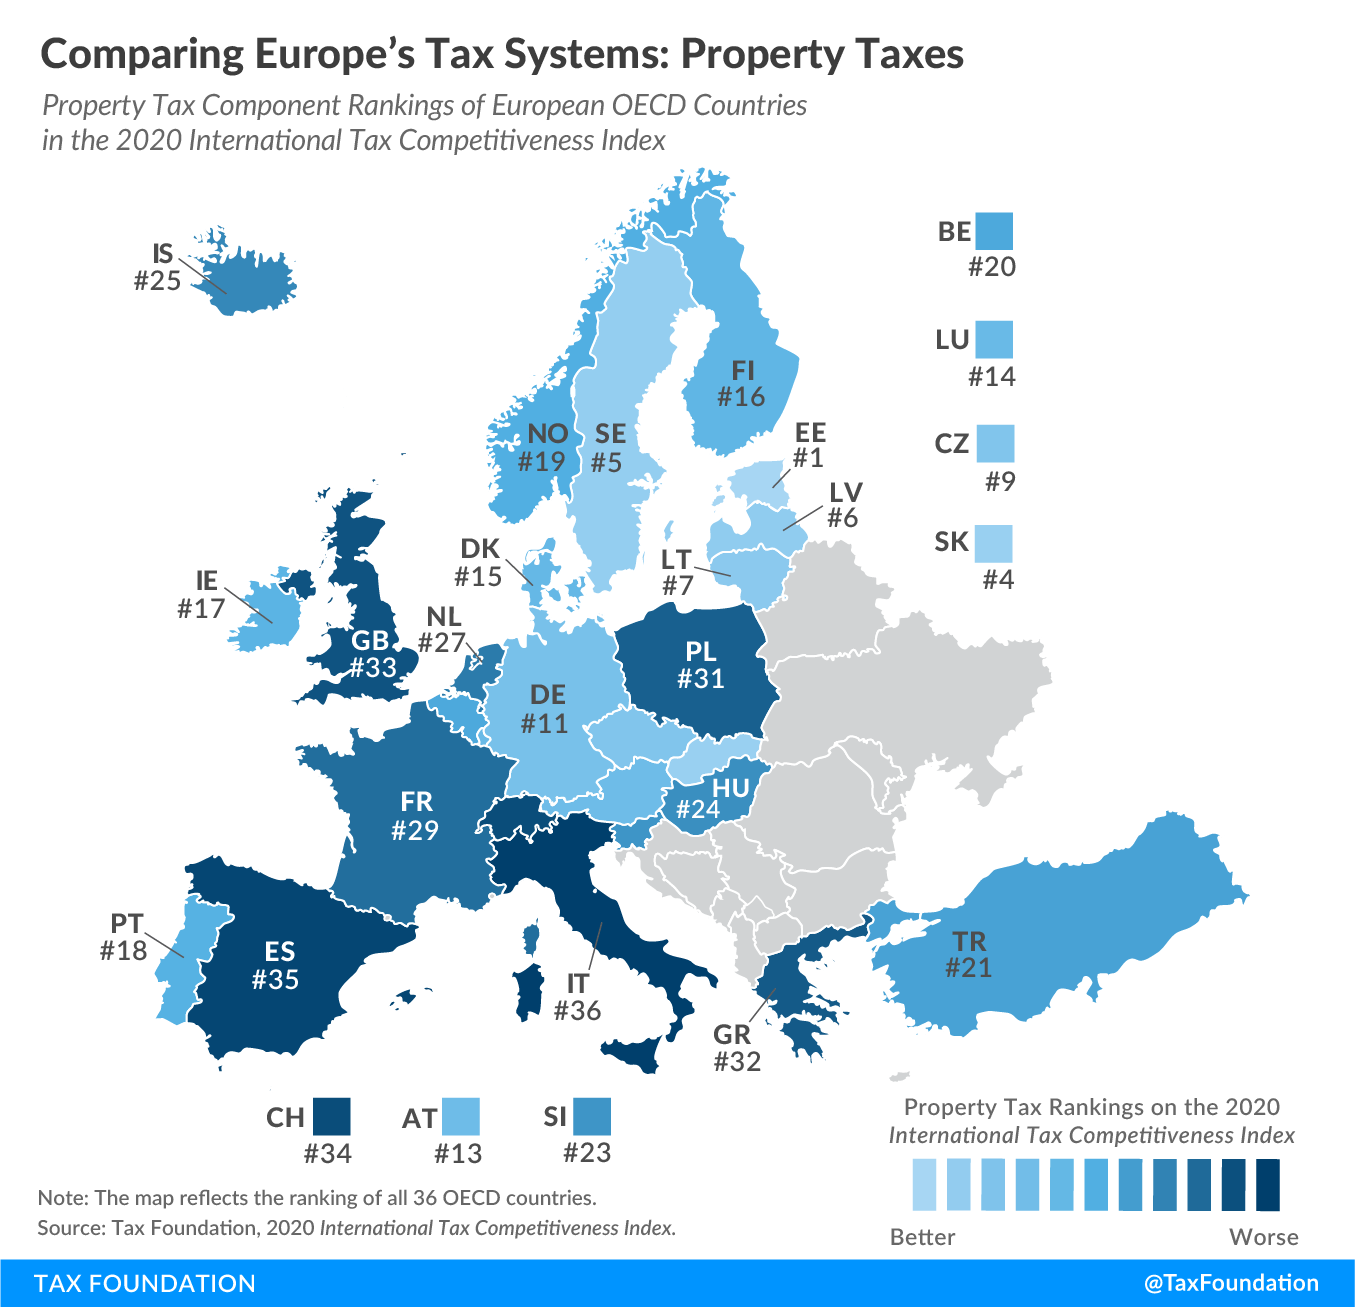
Estonia has the most efficient property tax system among OECD countries. Estonia’s real property tax only applies to the value of land, making it one of only three OECD countries (along with Australia and New Zealand) that exclude the value of buildings or structures on the land from the tax base. Estonia does not levy any other type of property tax covered in the ITCI.
Italy, by contrast, ranks worst in the ITCI’s property tax component. In addition to comparably high real property tax collections, Italy imposes a wealth tax on financial assets and properties held abroad, and taxes inheritances, real estate transfers, the issuance of shares, and financial transactions.
Click here to see an interactive version of OECD countries’ property tax rankings, then click on your country for more information about what the strengths and weaknesses of its tax system are and how it compares to the top and bottom five countries in the OECD.
To see whether your country’s property tax rank has improved in recent years, check out the following table. To learn more about how we determined these rankings, read our full methodology here.
| OECD Country | 2018 Rank | 2019 Rank | 2020 Rank | Change from 2019 to 2020 |
|---|---|---|---|---|
| Australia (AU) | 4 | 4 | 3 | +1 |
| Austria (AT) | 13 | 13 | 13 | 0 |
| Belgium (BE) | 28 | 30 | 20 | +10 |
| Canada (CA) | 21 | 21 | 22 | -1 |
| Chile (CL) | 12 | 12 | 12 | 0 |
| Czech Republic (CZ) | 9 | 9 | 9 | 0 |
| Denmark (DK) | 15 | 15 | 15 | 0 |
| Estonia (EE) | 1 | 1 | 1 | 0 |
| Finland (FI) | 18 | 17 | 16 | +1 |
| France (FR) | 36 | 28 | 29 | -1 |
| Germany (DE) | 11 | 11 | 11 | 0 |
| Greece (GR) | 30 | 31 | 32 | -1 |
| Hungary (HU) | 24 | 23 | 24 | -1 |
| Iceland (IS) | 23 | 24 | 25 | -1 |
| Ireland (IE) | 19 | 19 | 17 | +2 |
| Israel (IL) | 10 | 10 | 10 | 0 |
| Italy (IT) | 35 | 36 | 36 | 0 |
| Japan (JP) | 26 | 26 | 26 | 0 |
| Korea (KR) | 29 | 29 | 30 | -1 |
| Latvia (LV) | 6 | 6 | 6 | 0 |
| Lithuania (LT) | 7 | 7 | 7 | 0 |
| Luxembourg (LU) | 14 | 14 | 14 | 0 |
| Mexico (MX) | 8 | 8 | 8 | 0 |
| Netherlands (NL) | 25 | 25 | 27 | -2 |
| New Zealand (NZ) | 2 | 2 | 2 | 0 |
| Norway (NO) | 16 | 18 | 19 | -1 |
| Poland (PL) | 31 | 32 | 31 | +1 |
| Portugal (PT) | 17 | 16 | 18 | -2 |
| Slovak Republic (SK) | 3 | 3 | 4 | -1 |
| Slovenia (SI) | 22 | 22 | 23 | -1 |
| Spain (ES) | 34 | 35 | 35 | 0 |
| Sweden (SE) | 5 | 5 | 5 | 0 |
| Switzerland (CH) | 32 | 34 | 34 | 0 |
| Turkey (TR) | 20 | 20 | 21 | -1 |
| United Kingdom (GB) | 33 | 33 | 33 | 0 |
| United States (US) | 27 | 27 | 28 | -1 |
Note: This is part of a map series in which we examine each of the five components of our 2020 International Tax Competitiveness Index.
Original Article Posted at : https://taxfoundation.org/best-worst-property-tax-systems-europe-2020/