
Euronav, Under-Performer Of Its Own Physical Market
The author may have a short position in Euronav
Euronav NV is the world’s largest listed tanker company. While the analysts’ bias is overwhelmingly positive we observe negative factors across its book and income-power components. We are agnostic on the tanker market however the company’s balance of risks deserves attention.
if (typeof jQuery == ‘undefined’) { document.write(”); }

Q1 2020 hedge fund letters, conferences and more
Using the fleet profile, all the company available inputs for Q1-2020 and formula 1.1 we’ve reconstructed Euronav’s TCEs, a non-IFRS metric, apportioned by the fleet segment.
Euronav Earning-Base Inputs Q1-2020 (in $M)
A. voyages revenues 416.7
B. operating costs 32.7
C. voyages costs 53.9
D. Total TCEs 330.1 [A-B-C=D]
TCE=(Voyages revenues – operating costs – voyages costs)/ days
TCE average time charter equivalent (TCE) [1.1]
Table 1. Euronav Fleet Profile from the investor presentation May 2020
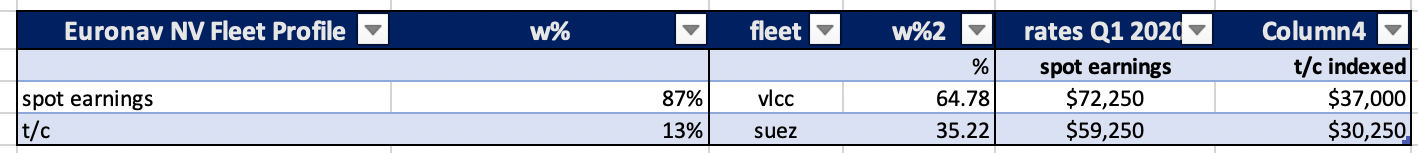
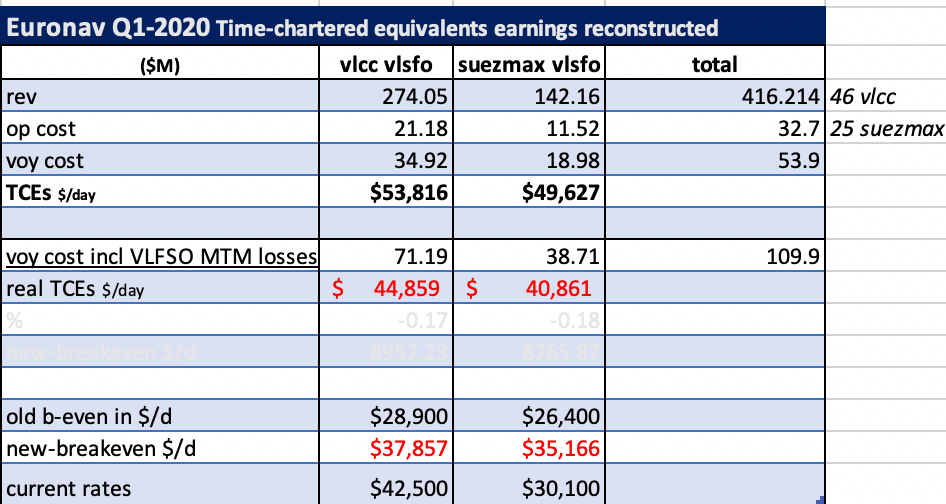
Table 2. Reconstructed average Time Charter Equivalents (TCEs) obtained by the company’s owned VLCC and Suezmax fleet trading
The company’s flagship highly spot-based VLCC trading (87% spot earning weight) under-performs the Q1-spot daily average metric by a margin of $27,391 per day when we fully integrate the VLSFO (very low sulfur fuel oil) costs.
Euronav inflates the way it represents the operating profitability (the TCEs) obtained by its owned fleet trading. They simultaneously use formula 1.1 to calculate the fleet earnings but exclude off-hire days (assumes a 100% utilization rate) and under reporting the fuel costs.
By mimicking the traders Euronav entertained the shipping nomenklatura and public view.
Set up in April 2019 Euronav NV Antwerp Geneva Branch was devised with the anticipation of IMO2020 coming into force in January 2020. *It was envisaged of possibly creating a marketing-arm to supply fuel and extend this related service to other companies for a profit.
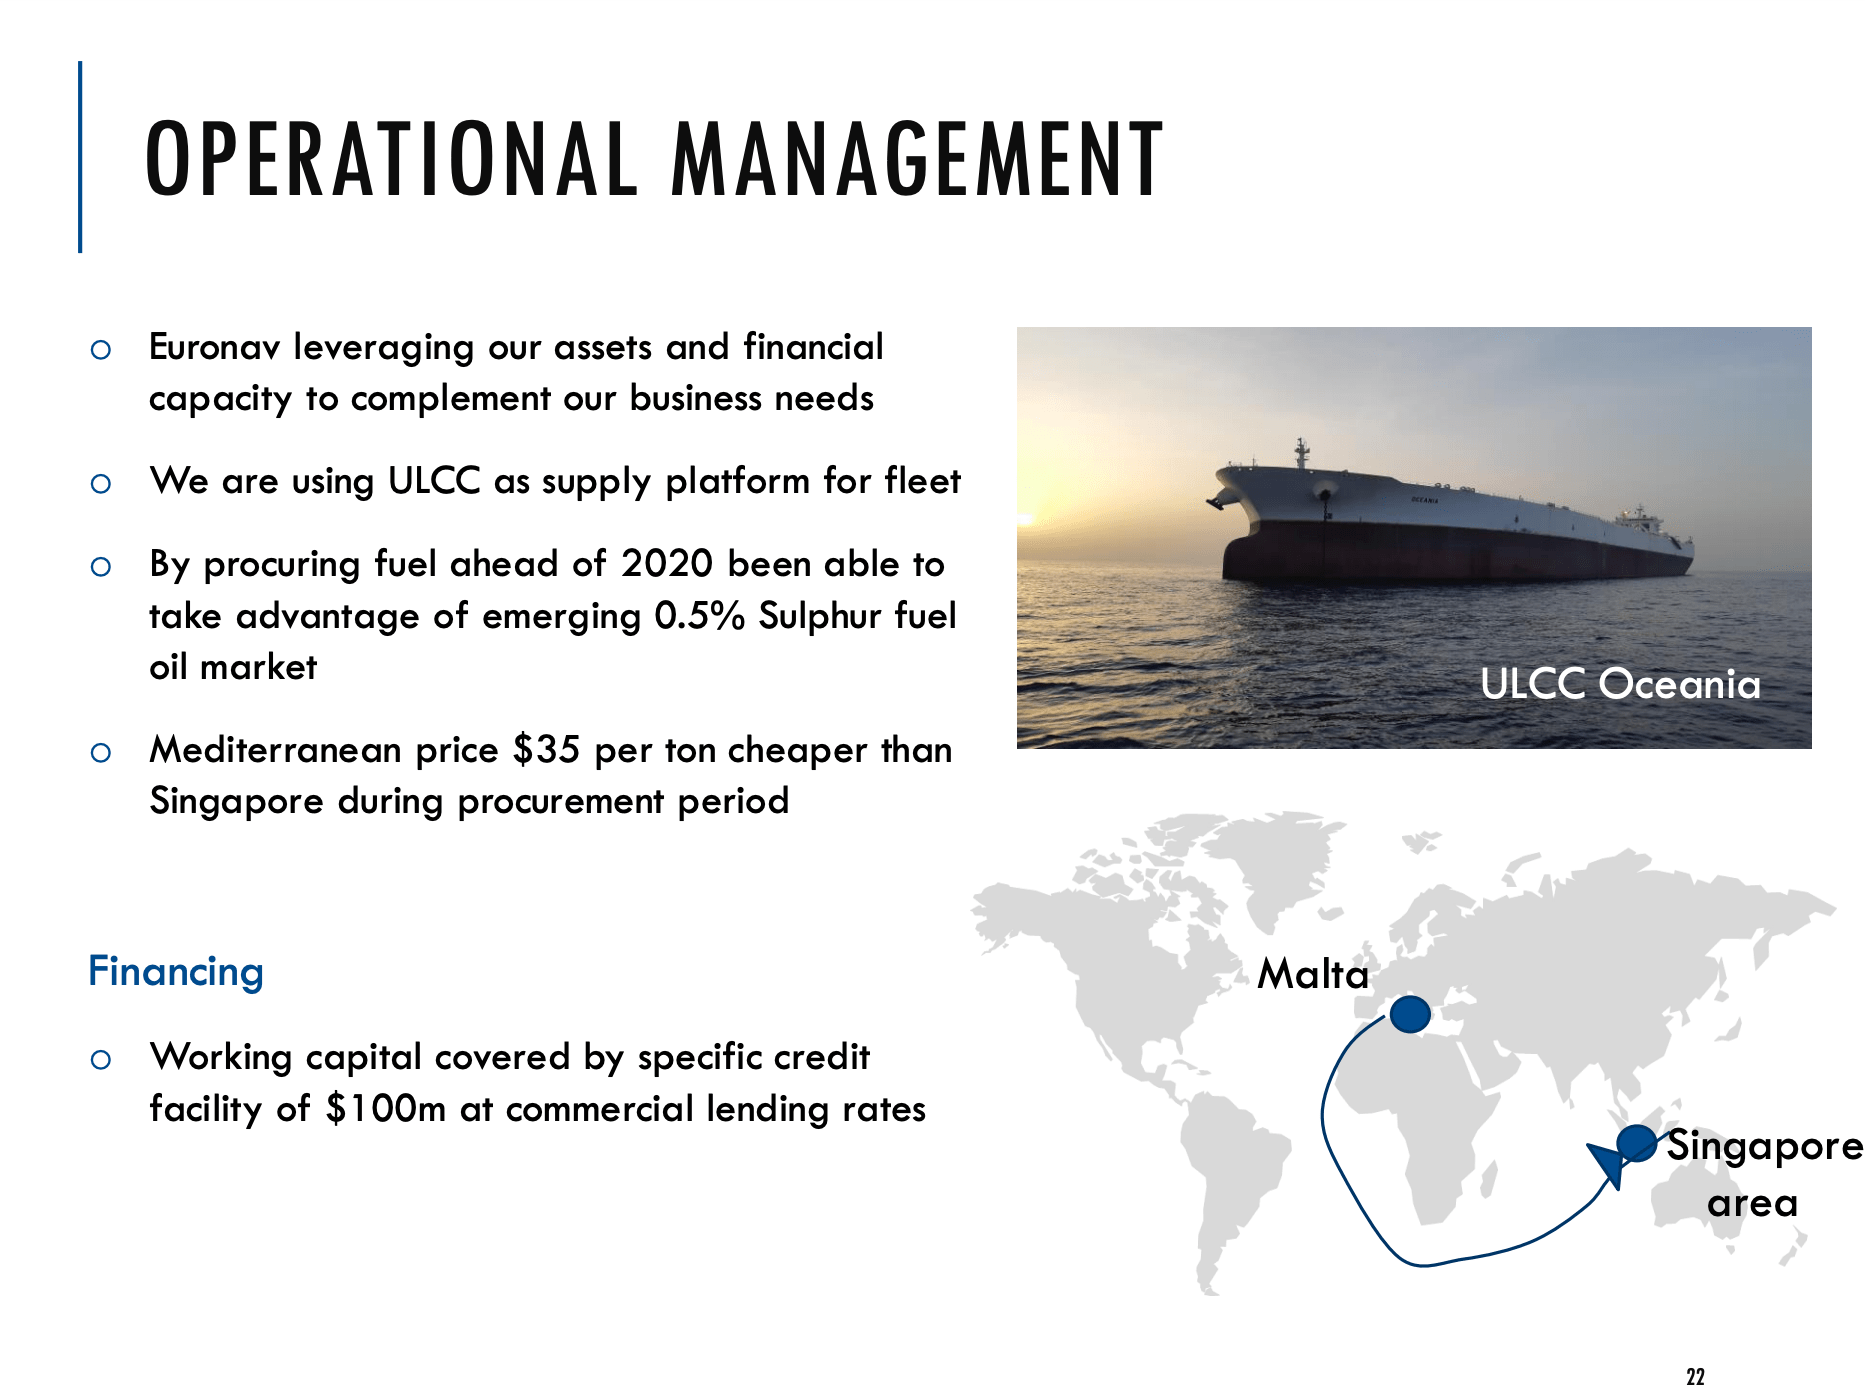
A trader entered for Euronav a complex trade to beat the market by using storage on the equivalent of 3M barrels on the Oceania (a ship acquired for $32.5M in 2018) seemingly with a day-by-day or vague risk tolerance / risk appetite statements from the onset.
In an environment of rising prices Euronav’s management was lauded as the “smartest guys” in the room.
Group-thinking analysts believed that VLSFO prices could only go up post IMO 2020.
It rendered it acceptable for Euronav to take risks on behalf of the shareholders “on-demand” and “play à la Vitol”.
On a flat price scale, the trader in Geneva might indeed have been right (for an intermediate period of time) but the company was wrong trying to chase the market; they just added risk to the balance-sheet.
IMO 2020 STRATEGY SEPTEMBER 2019
The Euronav Trade
- Euronav bought and stored 3 million barrels (420,000 tons) of VLSFO (very low-sulphur fuel oil) at an average price of $447/t)
- While the strategy appears to tentatively isolate the company from rising prices with the use of at-sea storage in the anticipation of IMO2020 the exact “hedge” basis is unclear.
- When a ship company stores oil that they consume later, it does not naturally eliminate the risk of loss on the position.
- Euronav took $100M debt in a revolving credit facility pledge against both the inventory stored and the ship with a syndicate of banks (named “Marine Money Deal of the Year Award Winner 2019″).
How much Euronav gain/lost since 2019 on the ULCC storage IMO fuel trade from where the company started this in June 2019 to where it ended ?
- The trader was long carry VLSFO stored on ULCC Oceania in Malaysian/Singapore coast and the flipside came during the price rout,
- The VLSFO value stored by shipowner on the Oceania is significantly below the company acquisition cost and at a LTV ratio of 125, it is plausible that Euronav had a margin call by the banks north of ~$336/mt basis SG.
- A LIBOR-funded agent has facilitated the banks’ sudden exit.
- Euronav now buys in the open market however the realized loss is improperly accounted for in its operating results.
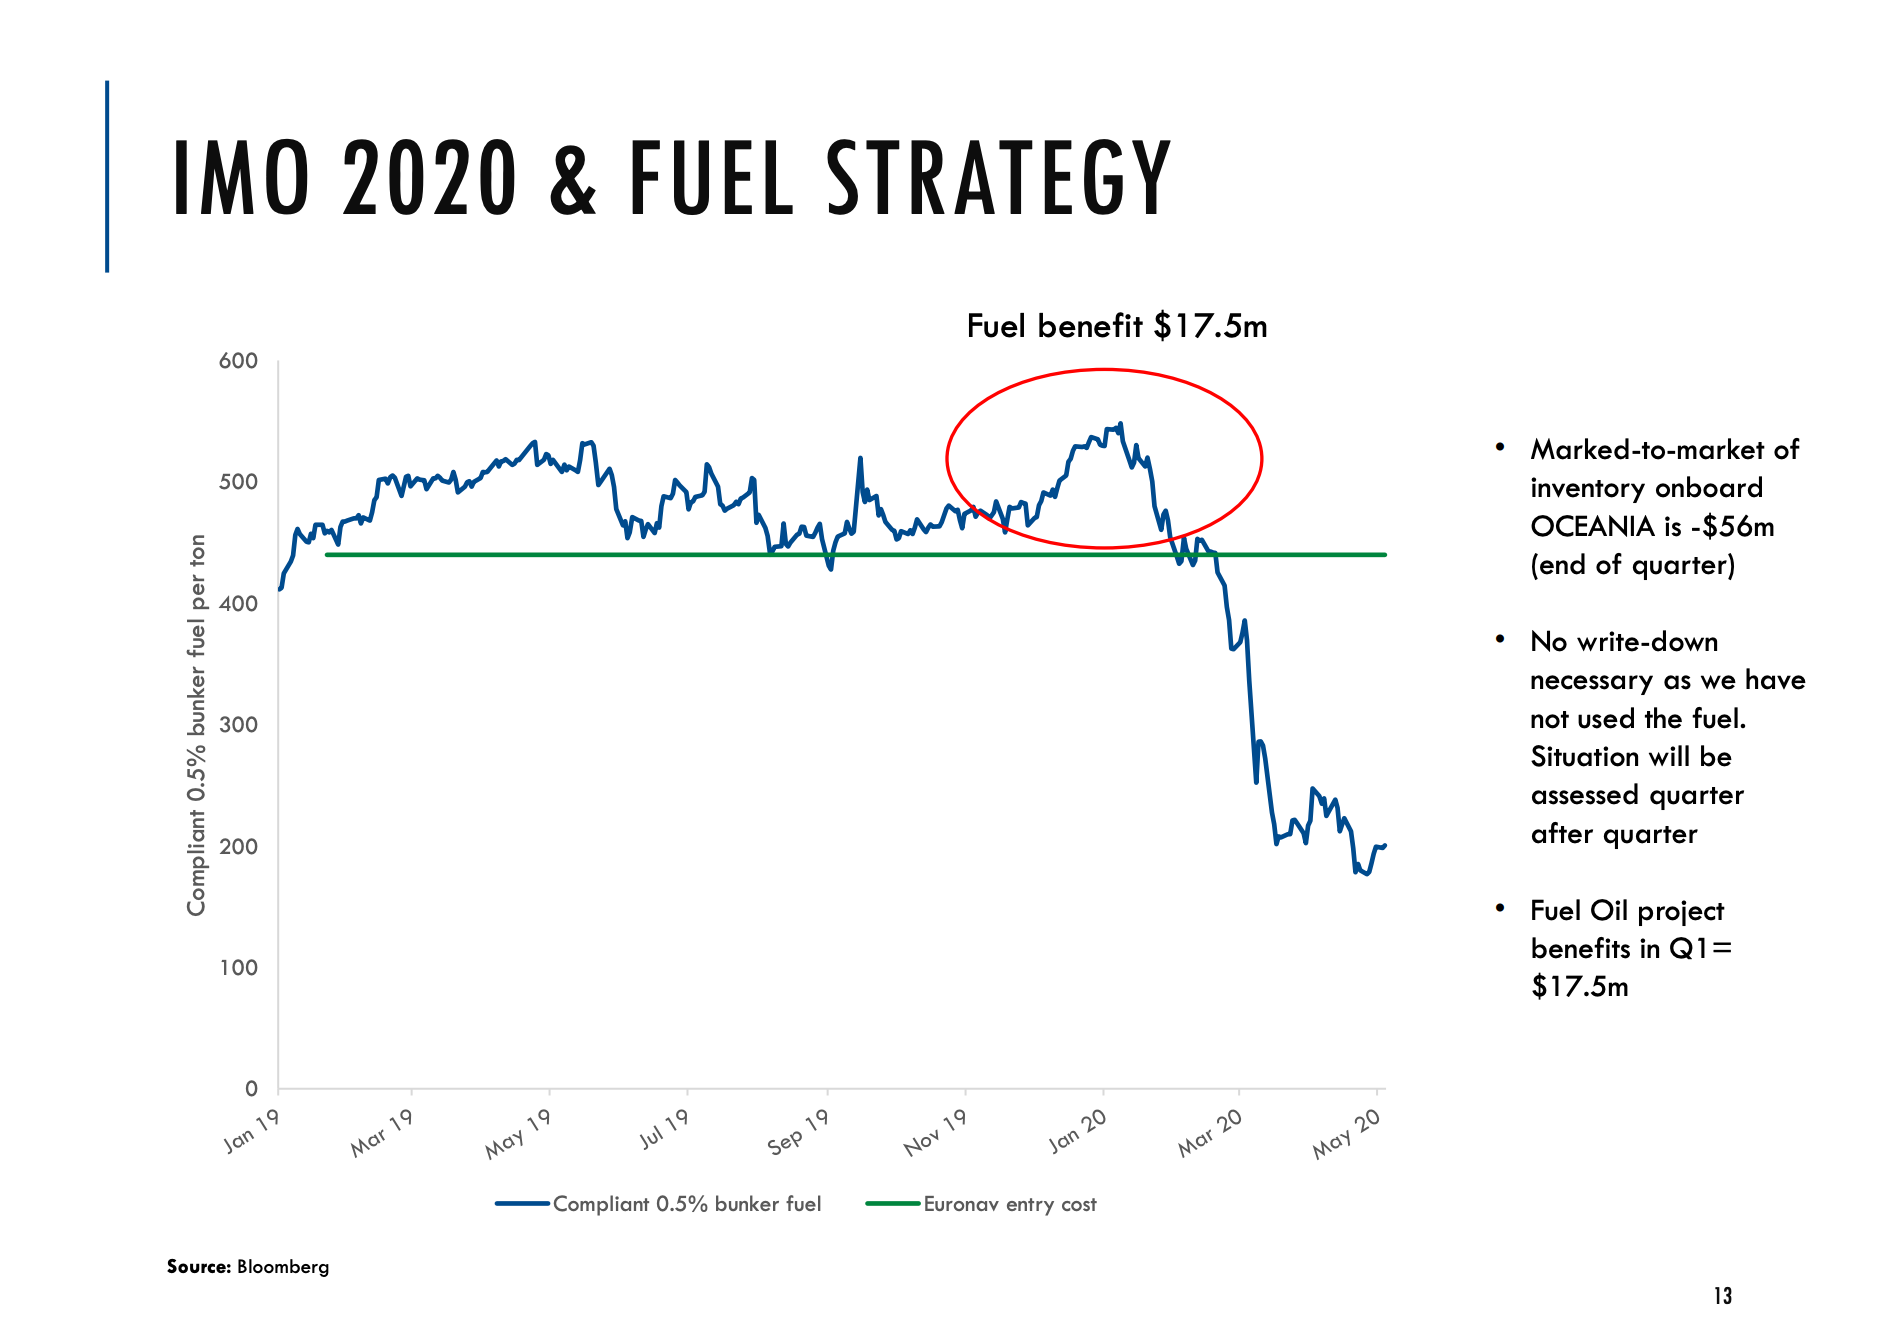
IMO STRATEGY AFTER WITH THE MTM LOSSES, Investors presentation May 2020
The Oceania is now being deployed by a Swiss trader who found an entry point $35,000 day rate for a period of 6-months to store its own distillate in Asia, a funny irony, at a time market contango reached an all time high.
This in reality stands at the bottom or just lower than the Euronav’s Oceania capital break-even cost and to all appearances will compound at a negative rate of return.
Euronav Reporting Issues
According to Euronav’s accounting treatment, the ineffective portion of the change in fair value of these derivatives is recognized directly in profit & loss but the company decided the stored fuel didn’t necessitate a write-down as this fuel was “unused”.
This had in turn an uplifting effect on the Q1-2020 operating margins, misrepresenting the true average time Charter Equivalent (TCE) obtained by the company’s fleet trading.
We were therefore forced to re-examine the earnings-base and restate Euronav EPS.
14. Bunker inventory the Group has been purchasing compliant bunker fuel for future use by its vessels. Bunkers are presented as inventory and are accounted for on a weighted average basis. The cost of inventories comprises the purchase price, fuel inspection costs and transport and handling costs.
The effective portion of the change in fair value of derivatives designated as cash flow hedges of the underlying price index between the date of purchase and the date of delivery is also recognized as an inventory cost.
The ineffective portion of the change in fair value of these derivatives is recognized directly in profit or loss.
The inventory is accounted for at the lower of cost and net realizable value with cost being determined on a weighted average basis.
Bunker expenses are recognized in profit or loss upon consumption.
Euronav Annual Report 2019
“During 2019, Euronav purchased 420,000 metric tonnes of compliant fuel and stored it on its vessel, the Oceania (2003 – 441,561 dwt). By March 31, Euronav had consumed approximately 200.000 tonnes of compliant fuel. In view of the significant drop in oil and fuel oil price in Q1, the Company stopped using its stored compliant fuel and purchased what was needed on the open market”.
The company also assessed if a write down should be accounted for the remaining compliant fuel inventory as the market value of the fuel that was not yet consumed was USD 56 million lower than its book value. The Company concluded that no write down was required at this time in view of the robust freight market for Q2 and possibly the rest of 2020, which will offset the higher weighted average consumption costs of the bunker oil consumed from that inventory.
Investor presentation May 2020
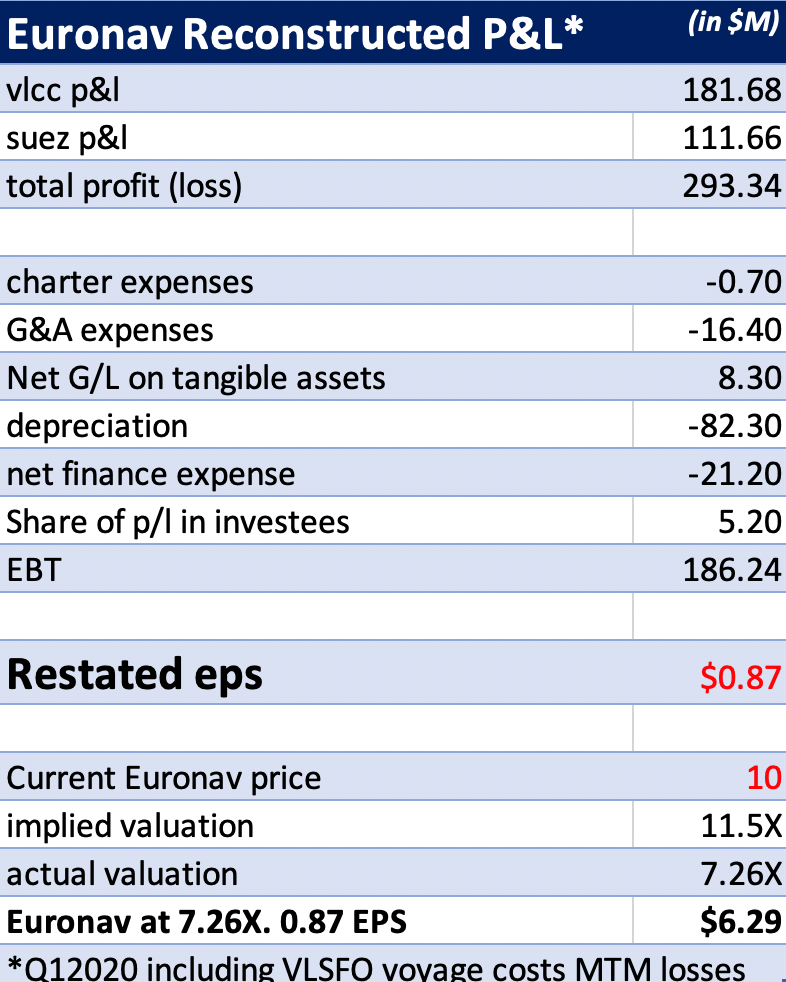
Table 3. Euronav reconstructed P&L
- Based on the relevant metric of 7.26 PE, the implied valuation that included the VLSFO voyage costs mark-to-market losses give us an imminent price of $6.29 per share.
- Even if the MTM losses were one-time or two-quarter occurrence, Euronav has now sufficiently caught our attention to understand its break-evens are patently higher than what its management has selectively decided to report.
The share price-at-risk is the by-product of a misconstrued appetite & tolerance to risk.
Based on all the available public information and the due diligence-based research on the company’s statements and accounts we’ve entered a net short position.
An Aggressive Capital Structure
Form 20-F reveals off-balance sheet liabilities of $263M on the top of a $300M forward capex in for 2020.
Additionally the management target 8% dividend ($174M) and a share buyback (43M prorated on 2020).
The total capex+off balance sheet+dividends is equal to more than $780M while the business ran operating cash-flows of $301M during Q1-2020 ( less than $486M for the trailing 12-months). On an operating cash flows to earnings basis the capital structure is pricing forward $169M net income per quarter result or a constant 101% basis Q1-restated TCE earning base.
Although we could be wrong, these assumptions appear unrealistic by the TCE earnings volatility standard.
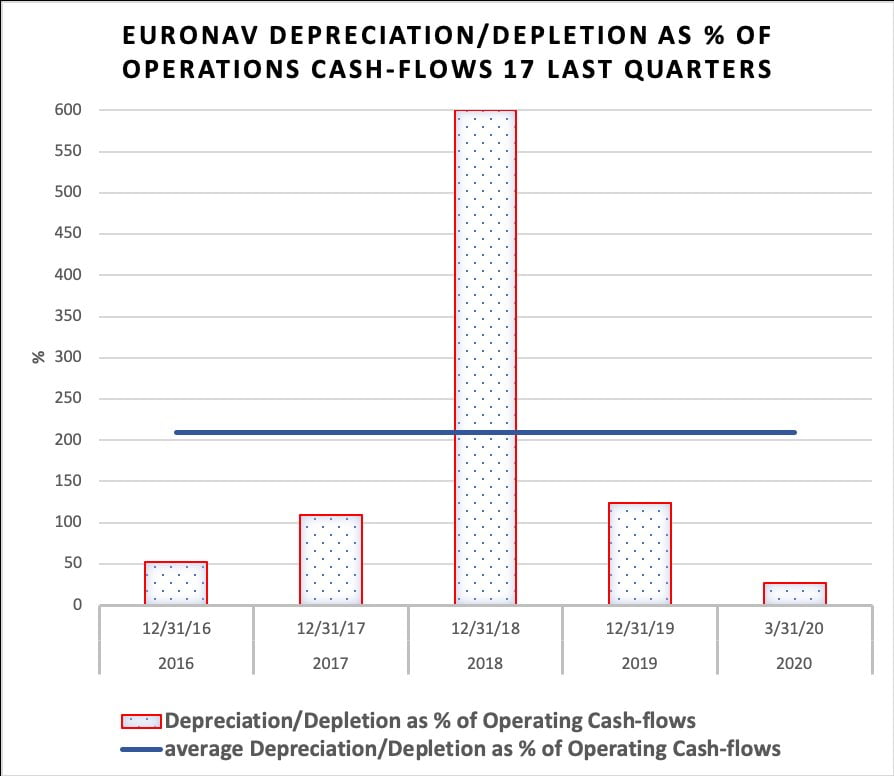
Chart 1. Euronav perennial average depreciation as a percentage of its operating-cash flows.
Depreciation of the capital is steady and increases the operating cash-flows. The question is more what they do with this depreciation; do the management use it in a good or bad capital allocation ?
The highly visible VLCC company-owned fleet (7.3 average age) is within the 10 years economic life. However the same can’t be said about the suezmaxes (comprising 35% of Euronav’s fleet) with 69% of its units aged above the 10 years economic life. This encapsulates the dilemma for Euronav in the next quarters: its VLCCs asset life has been optimized against the Suezmax segment at expense of the prompt-VLCC earnings.
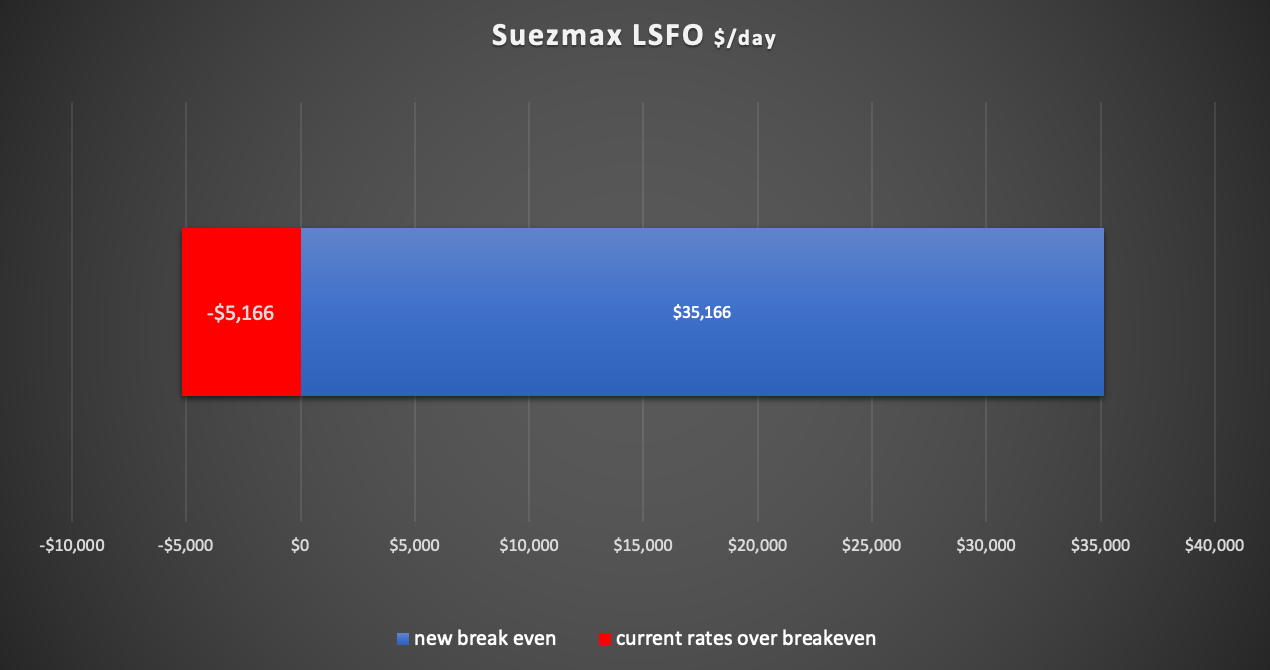
Chart 2. As we speak the Suezmax fleet segment loses $5,136 per day.
Our Beige Book
In a trading environment it might be easier to tie a strategy to dollars amount such as VaR but with respect to a shipping organization, the relevant quantifiable risk metrics are more analogous to break even rates and the share price-at-risk imbibed by the management decisions.
In our thesis the world’s largest listed tanker company neither fit a growth story or the value-play.
Euronav isn’t a constructive fraud like Noble Group. Its management could be better summarized as being actively rewarded to take “à la carte” risks.
If the bet collapses the price to pay is close to nothing, but the sum of these losses over the horizon will reveal the shipping outfit as an “under-performer of its own physical market”.
.fb_iframe_widget_fluid_desktop iframe { width: 100% !important; }
The post Euronav, Under-Performer Of Its Own Physical Market appeared first on ValueWalk.
Original Article Posted at : https://www.valuewalk.com/2020/06/euronav-physical-market/