
Lessons From The First Tech Bubble Show The Need for New Strategies
A great company doesn’t necessarily mean a great stock. This is worth remembering in an environment where valuations are near record levels. The first tech bubble between 1995 and 2000 is especially instructive for today’s environment, where a small group of rapidly growing tech companies has driven the market higher. Even investors who expect strong fundamentals to continue need to be concerned that earnings multiples will not stay high forever. New investment products can offer a better way for navigating this challenging environment.

Q1 2020 hedge fund letters, conferences and more
The First Dot-com Bubble
Between 1995 and March 2000, NASDAQ rose 4x before ultimately collapsing by nearly 80%. During the height of the bubble era, many tech companies with no revenue and questionable business models used the frothy conditions to raise capital in IPOs. The Pets.com sock puppet was perhaps the mascot for this category. Investors in the worst of the tech bubble companies lost most or all their money.
At the same time, there were also a handful of companies with solid business models that went on to define the modern world. These companies continued to thrive in the decades following the tech bubble collapse. Yet investors that correctly picked only the most successful companies at the top of the tech bubble still would have suffered gut wrenching losses. The pain would have lasted much longer than many people realize.
Here are three examples from the last tech bubble that are still relevant for investors today.
| Company | Peak during tech bubble | Date recovered | Revenue growth
between stock price peak and recovery |
Maximum stock price drawdown |
| Microsoft | December 1999 | October 2016 | 417% | -74% |
| Oracle | September 2000 | June 2017 | 474% | -84% |
| Amazon | December 1999 | October 2009 | 1495% | -94% |
Microsoft
Microsoft changed how the world does business with the Windows 95 operating system, and has consistently innovated, while growing revenue and market share for decades. Yet investors that bought Microsoft in late 1999 endured poor returns in spite of continued solid business performance. Microsoft stock closed at a split adjusted price of $59.56 on December 27, 1999. It did not exceed that level again until October 2016. The maximum stock price drawdown was 74%. Between 2000 and 2016, Microsoft increased revenue 417%, and increased earnings 260%. Yet the stock price languished. Correctly forecasting Microsoft’s earnings growth would have limited value during this period.
Oracle
Oracle’s stock price reached $46.31 on September 1, 2000, and did not recover that level until June 2017. Between 1999 and 2017, Oracle grew revenue nearly 474% , and earnings 730% , yet investors still suffered seventeen years of poor returns, and endured a drawdown of 84%. Even though Oracle grew both market share and profitability, investors who bought at the top still lost due to multiple contractions.
Amazon
Amazon, a distinguished member of the modern FAANG club, came to public markets during the first tech bubble. On December 10, 1999, Amazon’s stock closed at $106.69. Although Amazon’s business continued to thrive after the tech bubble burst, its stock closing stock price dropped as low as $5.97, on September 28, 2001. It didn’t recover that price until a decade later, in October 2009. Amazon’s annual revenue increased 1494% during the decade that its stock languished. Investors that held on for two decades would of course have experienced massive returns. Yet few investors have the sticky capital and stomach to hold an underwater stock position for over a decade.
Fundamentals and Sentiment
When buying a stock an investor is implicitly expressing a view on two things: future company earnings, and the future multiple that the market will place on those earnings. Company earnings are a measure of business performance, and multiples are a measure of sentiment and future expectations. An investor could reasonably be bullish on one and bearish on the other over any time period.
Most fundamental focused investors are better at business analysis than they are at analyzing how multiples will change. On the other hand, there are many quant based investors who are better at predicting sentiment shifts than they are at predicting fundamentals. The experience of Microsoft, Oracle, and Amazon in the years following the tech bubble highlight how much fundamentals and sentiment can diverge. Fortunately there is a solution.
Earnings Derivatives
Earnings derivatives are a tool for investing directly in company and industry earnings streams. This is implemented as a cash-settled option, where the strike “price” is based on a target earnings level, with expiration dates that coincide with the release of company earnings reports. Investors can go long or short company earnings for a particular quarter, with profits on their position directly tied to how much a company beats or misses earnings. Using earnings derivatives, investors can separate their view on earnings growth from their view sentiment changes when making long term investment decisions.
Given the historical lesson learned from the first tech bubble, earnings derivatives might be especially useful in today’s market environment.
FAANG Valuations and Today’s Market
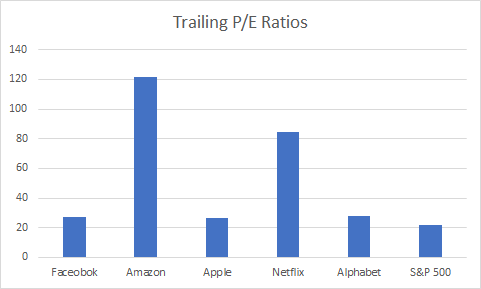
A key factor driving the market higher in recent years has been the FAANG Stocks- Facebook, Amazon, Apple, Netflix. The FAANG stocks are valued much higher than the rest of the market.
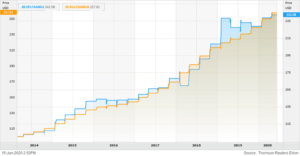
Although it might seem like this is tech bubble version 2.0, its possible that these high valuations are justified by fundamentals. BLX Global developed indices that track changes in the aggregate revenue and earnings for FAANG stocks. Both the FAANG Revenue index (.BLXGLFAANGR) and the FAANG Earnings Index(.BLXFLFAANGE) have consistently gone up since the index began in 2014.
FAANG dominance might continue. The Covid-19 pandemic has accelerated trends that favor FAANG stocks. More households have built a habit of doing all their shopping online because stores are closed. With movie theaters closed, people become more accustomed to watching streaming video at home. People are spending more time online in general.
On the other hand, some investors are skeptical that FAANG growth can last. FAANG companies face maturing markets, with increasing competition, frequently from each other. Expansion depends on entering new markets, far from their core businesses. Additionally, it will be hard for them to avoid antitrust scrutiny. Nonetheless, so far investors who have shorted the FAANG stocks based on valuation have incurred massive losses.
Even if FAANG companies continue to grow earnings and revenue, there is still the risk that multiples will collapse across the entire market. The catalyst could be inflation, an interest rate shock, or just a general collapse in market sentiment. There is also the risk that another sector could become more favored than technology. Stock market history shows that business success is no guarantee of stock performance.
Whether you’re bullish or bearish, if you have an edge in predicting business fundamentals, you might want to look beyond just direct equity positions and use earnings derivatives. Investors can use earnings derivatives to hedge or replace individual stock positions. The FAANG Earnings and FAANG Revenue indices can be used for options and structured notes, along with a variety of other derivative products.
The post Lessons From The First Tech Bubble Show The Need for New Strategies appeared first on ValueWalk.
Original Article Posted at : https://www.valuewalk.com/2020/06/lessons-first-tech-bubble/<\p>