
State Forecasts Indicate $121 Billion 2-Year Tax Revenue Losses Compared to FY 2019
Key Findings
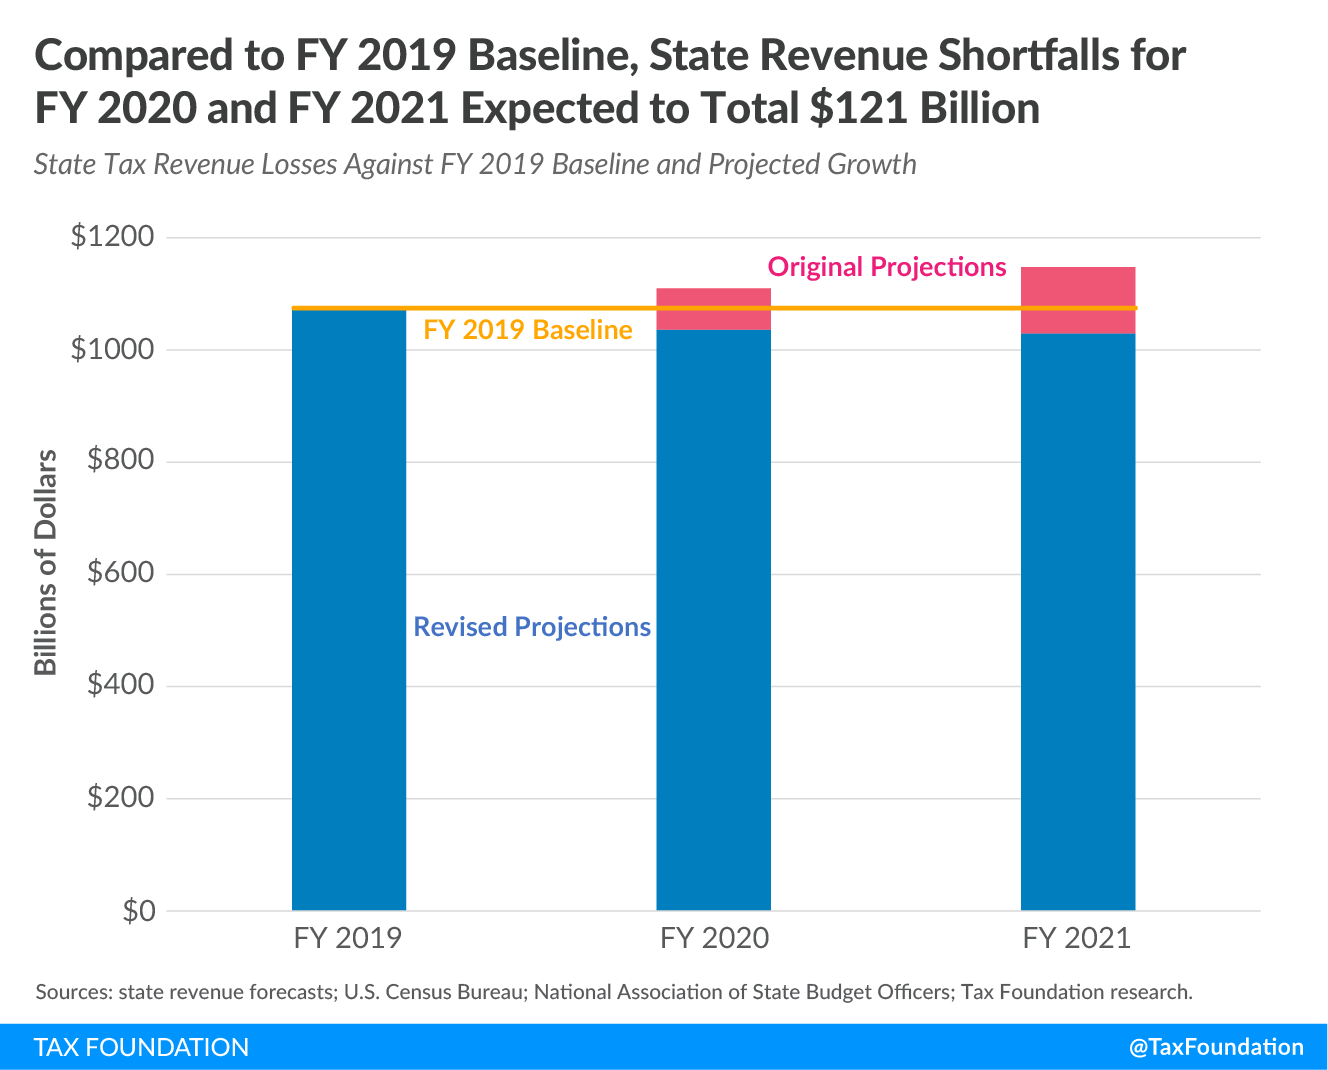
- Extrapolating from recently revised state revenue forecasts yields an estimated nationwide $121 billion decline in state tax collections across FYs 2020 and 2021 against a FY 2019 baseline, and $191 billion compared to initial tax revenue projections for those two years.
- These estimates are consistent with the results of other recent analyses, and, while representing significant losses, are at the lower end of many preliminary forecasts of the state revenue implications of the COVID-19 pandemic.
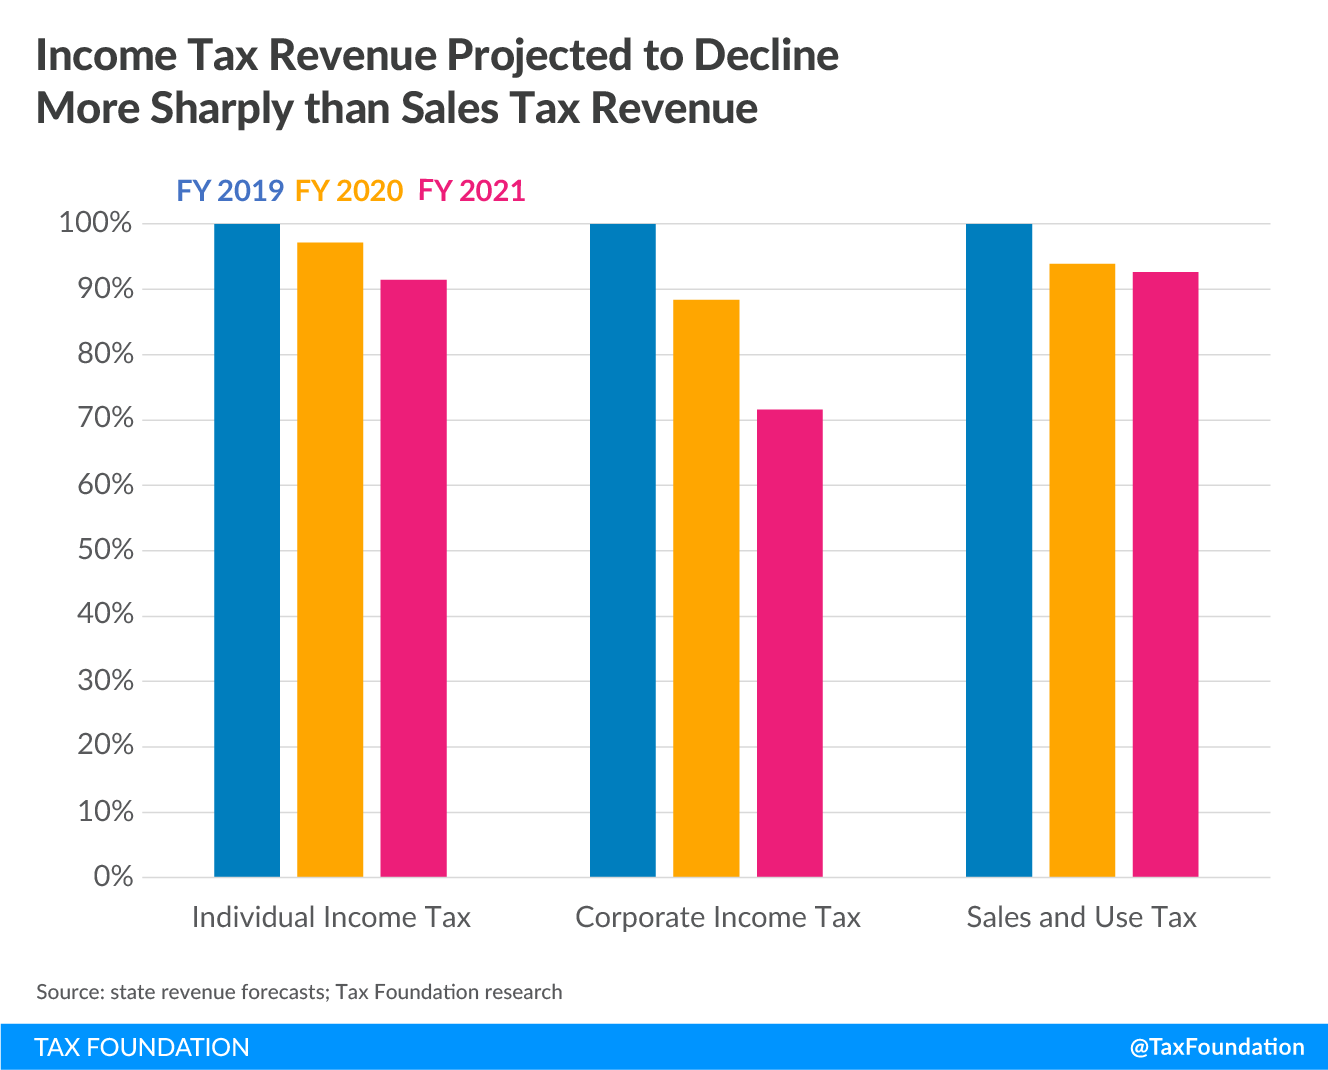
- All major taxes have been affected by the crisis, but for the current fiscal year, states expect income tax collections (both individual and corporate) to be further off the FY 2019 baseline than sales taxes, which may begin to stabilize as the sharp early contraction in consumer spending, at the outset of stay-at-home orders, gives way to somewhat more typical spending patterns.
- Although these numbers should be regarded as provisional, and no one can fully account for the possibility of subsequent economic shocks, they can help federal lawmakers formulate an appropriate response when designing any further package of state and local relief.
Introduction
Revised state revenue forecasts show a significant decline in projected revenues for both the recently concluded FY 2020 and current FY 2021, though the picture they paint is considerably less dire than many feared a few months ago. Extrapolating from available data suggests a $121 billion nationwide decline in state tax revenue for the two fiscal years compared to a FY 2019 baseline, though estimates from such limited and provisional data should be regarded with caution. What is increasingly clear, however, is that revenue losses, while substantial, are not on track to match the worst fears of many analysts earlier in the COVID-19 pandemic.
Another point coming into focus is that, while the sales tax took an immediate hit as stay-at-home orders went into place, income taxes—both individual and corporate—are likely to experience greater losses and will take longer to recover. This is consistent with the experience of past recessions.
Policymakers can glean important insights from states’ efforts to model the effect of the COVID-19 pandemic on revenue outlooks. The data are provisional and incomplete, but taken together, they contribute to our understanding of how the pandemic is playing out in state capitols.
Interpreting the Revised Projections
States have struggled to update their revenue forecasts, as analysts are effectively being asked to make predictions that are as much epidemiological as they are economic. Projections made early in the pandemic varied widely, whereas more recent forecasts are clustered somewhat more closely together. State-specific figures have consistently been less dire than broad national predictions, which seem to have overstated the economic and revenue impact; however, should a resurgence of the virus force renewed closures later in the summer or fall, estimates could easily change once again.
State projections are inconsistent, making comparisons difficult. Many states have hesitated to release revised forecasts, and it is possible that these states differ economically from the cohort that have provided updated forecasts. Some have only issued new topline revenue data, declining to project the performance of individual taxes. And because assumptions about the virus and its economic impact have evolved, forecasts made in March or April are not necessarily comparable with those made later.
Decisions to delay filing and payment deadlines complicated efforts to assess the fiscal costs of the pandemic, as it is difficult to disentangle declines in tax revenues associated with delayed payment from those associated with actual economic losses. Broader economic data used in forecasting, moreover, have not always reduced the uncertainty, with each new data release providing a different snapshot of rapidly changing economic conditions. Even with the benefit of several months of data, forecasting is exceedingly difficult, though there is greater clarity now than there was a few months ago.
For this analysis, we have compiled available projections from states which (1) issued their latest revised projections no earlier than May 1st, (2) enumerated projections by major tax type, and (3) offered revised projections at least through FY 2021, the fiscal year which began July 1, 2020. Twelve states representing about one-quarter of all state tax collections have done so: California, Colorado, Delaware, Illinois, Iowa, Louisiana, Montana, New Hampshire, Pennsylvania, Rhode Island, Utah, and Wyoming.
These states should not be assumed to be fully representative of the broader economy, and four (Delaware, Montana, New Hampshire, and Wyoming) forgo one or more major tax types, meaning that subcategories contain fewer states. Nevertheless, the data are sufficient to help us see how states expect different taxes to respond to the crisis, and to enhance our understanding of how much tax revenue states stand to lose.
Performance of Major Tax Types
For these states, individual income tax revenues are projected to be 9 percent lower in the current fiscal year than they were in FY 2019. Corporate income tax collections will fall significantly more, down 28 percent, while sales and use taxes will have declined the least (though still substantially) at 7 percent. Notably, however, sales tax revenues appear to be further off target for the fiscal year that just ended, down 6 percent, compared to just 3 percent for individual income taxes.
This makes sense. Purchases were delayed immediately, whereas most income taxes being collected in the first half of calendar year 2020 (the latter half of fiscal year 2020) were still from the 2019 tax year. Reduced wages, declining employment, and the taking of capital losses will all show up more substantially in the fiscal year we have just entered, and the recovery will take longer. Corporations, meanwhile, are taxed on their net income (profits), and many businesses are currently posting losses and thus lack corporate income tax liability.
These projections are also roughly consistent with recent findings that a one percentage-point change in employment is associated with a 1.19 percent change in sales tax revenues, a 1.63 percent change in individual income tax revenues, and a 4.13 percent change in corporate income tax revenues.[1] Put another way, individual income taxes are 37 percent more sensitive to employment changes than are sales taxes, while corporate income taxes are 247 times more sensitive.
Despite initial variation due to the uniqueness of pandemic-driven business closures and stay-at-home orders, moreover, projections for FY 2021 align with the experience of the Great Recession and past recessions, where income taxes fell more steeply and took longer to recover than did sales taxes.

While most of us curtail some expenditures during an economic downturn, there is only so much we can—or are willing to—cut. Even those with no wage income continue to consume, supported by savings and governmental assistance, while those whose incomes decline are likely to reduce savings rates more drastically than consumption. Corporate income tax collections are the most volatile because, even in a deep recession, most individuals earn taxable income, whereas corporations may post actual losses and thus have no net income to tax.[2]
Scope of Revenue Losses
The 12 states in our survey have different overall revenue mixes, but we can extrapolate from the performance of each major tax type to gain insight into the broader revenue picture. These estimates suggest that FY 2020 tax revenue will be $41 billion lower than FY 2019 revenue, and that FY 2021 revenues will decline by another $39 billion ($80 billion below FY 2019 levels), meaning that tax collections over these two fiscal years will come in $121 billion lower than they would have at constant FY 2019 levels.[3]
States did not, of course, expect revenue to remain flat across those two fiscal years, anticipating 3.0 percent revenue growth in FY 2020 and a further 3.4 percent growth in FY 2021.[4] A two-year revenue loss of $121 billion against a FY 2019 baseline suggests that tax revenues will be $191.1 billion lower than states had projected for the biennium.
| Baseline | FY 2020 | FY 2021 | Two-Year Total |
|---|---|---|---|
|
FY 2019 Revenues |
-$41.0 billion | -$80.0 billion | -$121.0 billion |
|
FYs 2020-’21 Growth Projections |
-$73.3 billion | -$117.8 billion | -$191.1 billion |
|
Sources: State revenue forecasts; National Association of State Budget Officers; Tax Foundation calculations. |
|||
These are significant shortfalls, though perhaps not as much as those anticipated by proponents of several proposed state and local aid packages. In April, Moody’s projected two-year losses of $274 billion against a FY 2019 baseline,[5] which was itself less pessimistic than the emerging view in Washington, D.C. at the time. State forecasts since then have proven less pessimistic than the ratings agency, and far less pessimistic than the concerns which drove the introduction of a state and local aid package totaling more than $1 trillion.[6]
A recent modeling effort by Christos Makidris (MIT) and Robert McNab (ODU) produced estimated one-year losses of $112 billion,[7] which is similar to our extrapolation of $117.8 billion in losses against projection for FY 2021. Using a broader range of revised forecast data (incorporating topline-only estimates and those made earlier in the crisis), the Tax Policy Center estimated tax revenue shortfalls of $200 billion across the two fiscal years ($125 billion in FY 2021),[8] which matches closely with our estimate of $191.1 billion in losses against initial forecasts. The National Conference of State Legislatures (NCSL) maintains its own table of state forecasts; extrapolating from midpoint estimates as compiled by NCSL yields a loss of about $154 billion compared to initial revenue projections in FY 2021.[9]
|
Makidris & McNab |
$112 billion |
|
Tax Foundation |
$118 billion |
|
Tax Policy Center |
$125 billion |
|
NCSL (extrapolation) |
$154 billion |
|
Note: NCSL estimate extrapolated using midpoint revenue loss percentages weighted by each reporting state’s share of total tax collections. Sources: Makidris & McNab; Tax Policy Center; National Conference of State Legislatures; state revenue projections; U.S. Census Bureau; Tax Foundation calculations. |
|
Revenue projections made prior to the onset of the pandemic, of course, anticipated growth. In practice, most states began to reduce expenditures in the latter part of FY 2020, and the postponement of planned spending increases is usually among the least fraught choices a state can make, which is why a comparison against the baseline of the last pre-crisis year (FY 2019) is helpful. The amount of the FY 2021 shortfall against projected revenues ($117.8 billion) is virtually identical with the shortfall for both fiscal years ($121.0 billion) compared to a baseline of actual FY 2019 collections.
Similar forecasts are not readily available on a widespread basis in the realm of municipal finance. However, local tax collections nationwide are just under 70 percent of state tax collections, and local revenue losses should, on the whole, prove less precipitous than declines in state revenue. This is largely a function of differing tax mixes, with local governments relying heavily on property taxes (which are significantly more stable than most state taxes) and to a lesser degree on sales taxes.
Local governments do face two unique sources of concern, however: (1) the nature of their finances and the services they provide give them less flexibility in responding to shortfalls; and (2) in much of the country, state aid plays a substantial role in local government finance, and is frequently one of the first line items to be reduced during an economic downturn.
If we assume that local government tax revenues decline at about two-thirds the rate that state revenues do, then the two-year local tax revenue loss against a FY 2019 baseline would be about $56.5 billion for FYs 2020 and 2021, or about $89.2 billion against growth projections in line with those identified by the states. This yields a combined state and local estimated two-year revenue loss of $177.5 billion against a FY 2019 baseline and $280.3 billion against anticipated revenues.
| Baseline | State | Local | Combined |
|---|---|---|---|
|
FY 2019 Revenues |
-$121.0 billion | -$56.5 billion | -$177.5 billion |
|
FYs 2020-’21 Growth Projections |
-$191.1 billion | -$89.2 billion | -$280.3 billion |
|
Sources: State revenue forecasts; National Association of State Budget Officers; Tax Foundation calculations. |
|||
Any federal aid package is likely to take fiscal years beyond FY 2021 into account since state revenues will take several years to recover. States do, moreover, have non-tax sources of revenue (university tuition, lottery revenues, inspection fees, etc.) that are similarly affected by the COVID-19 pandemic. At the same time, however, a federal relief package is unlikely to be designed with the intention of covering the entirety of state and local revenue losses. Recognizing the unique challenges of a pandemic-induced economic downturn, many members of Congress appear open to providing state and local governments with fiscal relief, but not to eliminating any obligation on the part of those governments to address the shortfall.
Implications for Federal Aid
States face a significant loss of tax revenue in FY 2021 and beyond due to the COVID-19 pandemic, but estimates of the scope of those losses continue to evolve. The debate surrounding a federal relief package has included questions of whether relief should be made open-ended through automatic stabilizers, and if and how the funding should be allocated. The emerging picture of states’ revenue shortfalls argues, at the very least, for a less expansive package than those floated in late spring.
Whatever the size of such a relief package, federal lawmakers should be careful not to eliminate incentives for state and local governments to prepare for the next downturn or to induce them to undertake imprudent expenditures. If a relief package were to be tied to economic indicators like an increase in state unemployment, staging the allocation of relief would allow the flow of funding to adjust to changing conditions. Even with population-based allocation methods, which are among the most equitable ways to distribute funding, staggered transfers may be desirable to encourage states to begin to make the necessary adjustments now.
As members of Congress consider the scope of that package, however, these revenue projections can be helpful. Each state operates on its own set of assumptions, and their estimates are not directly comparable. But taken together, they can help bring into focus the view from the statehouses.
Losses look to be steep. Our extrapolation suggests about $121 billion in declining tax revenues between FY 2020 and FY 2021 compared to a FY 2019 baseline, and over $191 billion against initial projections for those years. But these figures are, for now at least, substantially better than some of the posited worst-case scenarios. Beyond that, there is real value in being able to home in on more accurate figures as new data emerge and new forecasts can be made. States’ current projections will not be the last word on the matter, but they are what we have right now—and for that, they have real value.
[1] Christos Makidris and Robert McNab, “The Fiscal Cost of COVID-19: Evidence from the States,” June 22, 2020, revised July 9, 2020, https://papers.ssrn.com/sol3/papers.cfm?abstract_id=3626497.
[2] Jared Walczak, “Income Taxes Are More Volatile Than Sales Taxes During an Economic Contraction,” Tax Foundation, Mar. 17, 2020, https://taxfoundation.org/income-taxes-are-more-volatile-than-sales-taxes-during-recession/.
[3] California issued projections for both L- and U-Shaped recoveries, while Utah offered both high- and low-range estimates. For both states, midpoint estimates were used. Because states’ smaller miscellaneous taxes vary widely, their rate of decline was estimated using a broader sample of states (incorporating forecast revisions from earlier in the pandemic), and the rate of decline used is nearly identical to the one implied in the Tax Policy Center’s recent analysis. See Lucy Dadayan, “COVID-19 Pandemic Could Slash 2020-21 State Revenues by $200 Billion,” Tax Policy Center, July 1, 2020, https://www.taxpolicycenter.org/taxvox/covid-19-pandemic-could-slash-2020-21-state-revenues-200-billion.
[4] National Association of State Budget Officers, “Fiscal Survey of the States,” Spring 2020, 40, https://www.nasbo.org/reports-data/fiscal-survey-of-states.
[5] Moody’s Investors Service, “Revenue Recovery from Coronavirus Hit Will Lag GDP Revival, Prolonging Budget Woes,” Apr. 24, 2020, https://www.law360.com/articles/1268199/attachments/0.
[6] Jared Walczak, “Designing a State and Local Government Relief Package,” Tax Foundation, May 12, 2020, https://taxfoundation.org/state-and-local-relief-package-coronavirus-relief-fund-cares-act/.
[7] Christos Makidris and Robert McNab, “The Fiscal Cost of COVID-19: Evidence from the States” (converted to 2019 dollars).
[8] Lucy Dadayan, “COVID-19 Pandemic Could Slash 2020-21 State Revenues by $200 Billion.”
[9] National Conference of State Legislatures, “Coronavirus (COVID-19): Revised State Revenue Projections,” July 7, 2020, https://www.ncsl.org/research/fiscal-policy/coronavirus-covid-19-state-budget-updates-and-revenue-projections637208306.aspx; U.S. Census Bureau, “Quarterly Summary of State & Local Tax Revenue (QTAX),” https://www.census.gov/programs-surveys/qtax.html. This represents our extrapolation based on listed revenue loss percentages for each state. Midpoints used where ranges are given.
Original Article Posted at : https://taxfoundation.org/state-revenue-forecasts-state-tax-revenue-loss-2020/