
Testimony: Senate Budget Committee Hearing on the Progressivity of the U.S. Tax Code
Note: The following is the testimony of Scott A. Hodge, President of the Tax Foundation, prepared for a Senate Budget Committee Hearing on March 26, 2021, titled, “Ending a Rigged Tax Code: The Need to Make the Wealthiest People and Largest Corporations Pay Their Fair Share of Taxes.”
Table of Contents
- The Rich Bear America’s Tax Burden
- Millions Benefit from Tax Credits and Pay Zero Income Taxes
- Our Fiscal System Redistributes $1.7 Trillion from the Rich to Everyone Else
- The Numbers Add Up to a Lot of Redistribution
- The Danger of Taxing Wealth—Enriching Foreign Billionaires
- When You Tax Corporations You Get Less of Them
- — Instead, You Get More Pass Throughs and Perceptions of Rising Inequality
- U.S. Tax System Is Most “Business Dependent”
- The Corporate Tax Is the Most Harmful for Economic Growth
- Workers (Often Women and Low-Skilled) Bear the Burden of Corporate Taxes
- Competitiveness Matters
- Conclusion
Chairman Sanders, Ranking Member Graham, and members of the Committee. Thank you for the opportunity to testify before you today.
There is no objective standard for what defines “fair share”; it is a purely subjective concept. But there are facts, which are objective, and the facts suggest that the U.S. tax and fiscal system is very progressive and very redistributive. These facts are contrary to popular opinion and contrary to the premise of this hearing.
Internal Revenue Service (IRS) data indicates that the wealthy in America are bearing the heaviest share of the income tax burden than in any time in recent memory. On the other hand, more than 53 million low- and middle-income taxpayers pay no income taxes after benefiting from record amounts of tax credits, and six out of 10 households receive more in direct government benefits than they pay in all federal taxes.
Meanwhile, the U.S. tax system is one of the most “business dependent” systems anywhere as American businesses pay or remit 93 percent of the nation’s taxes. Economic studies show that workers bear at least half of the economic burden of corporate taxes through lower wages, with women, the low-skilled, and younger workers impacted the most. And because the corporate income tax is the most harmful tax for economic growth, raising the corporate tax rate would not only slow the economy, it would also make the U.S. an outlier once again against our global trading partners.
Let’s dive into the facts.
The Rich Bear America’s Tax Burden
Most Americans would be surprised to learn that a 2008 study by economists at the Organisation for Economic Co-operation and Development (OECD) found that the U.S. had the most progressive income tax system of any industrialized country at the time.[1] Their study showed that the top 10 percent of U.S. taxpayers paid a larger share of the tax burden than their counterparts in other countries and our poorest taxpayers had the lowest income tax burden compared to poor taxpayers in other countries due to refundable tax credits such as the Earned Income Tax Credit and the Child Tax Credit.
Our income tax code has only gotten more progressive since then because of Washington’s continuing effort to help working class taxpayers through the tax code.
According to the latest IRS data for 2018—the year following enactment of the Tax Cuts and Jobs Act (TCJA)—the top 1 percent of taxpayers paid $616 billion in income taxes. As we can see in Figure 1, that amounts to 40 percent of all income taxes paid, the highest share since 1980, and a larger share of the tax burden than is borne by the bottom 90 percent of taxpayers combined (who represent about 130 million taxpayers).[2]

In case you are thinking, “Well, the rich make more, they should pay more,” the top 1 percent of taxpayers account for 20 percent of all income (AGI). So, their 40 percent share of income taxes is twice their share of the nation’s income.
Similarly, in 2018, the top 0.1 percent of taxpayers paid $311 billion in income taxes. That amounted to 20 percent of all income taxes paid, the highest level since 2001, as far back as the IRS data allows us to measure. The top 0.1 percent of taxpayers in 2018 paid a greater share of the income tax burden than the bottom 75 percent of taxpayers combined.
Millions Benefit from Tax Credits and Pay Zero Income Taxes
It is hard to say that the tax code is rigged in favor of the rich when more than 53 million taxpayers, more than one-third of all taxpayers, have no income tax liability because of the numerous credits and deductions that have been created or expanded in recent decades.
As Figure 2 illustrates, the percentage of these filers with no liability began to grow following the Tax Reform Act of 1986 expansion of the zero tax bracket. Since the creation of the Child Tax Credit in 1997 the percentage of income tax filers who have no tax liability increased from 23.6 percent to 34.7 percent in 2018.
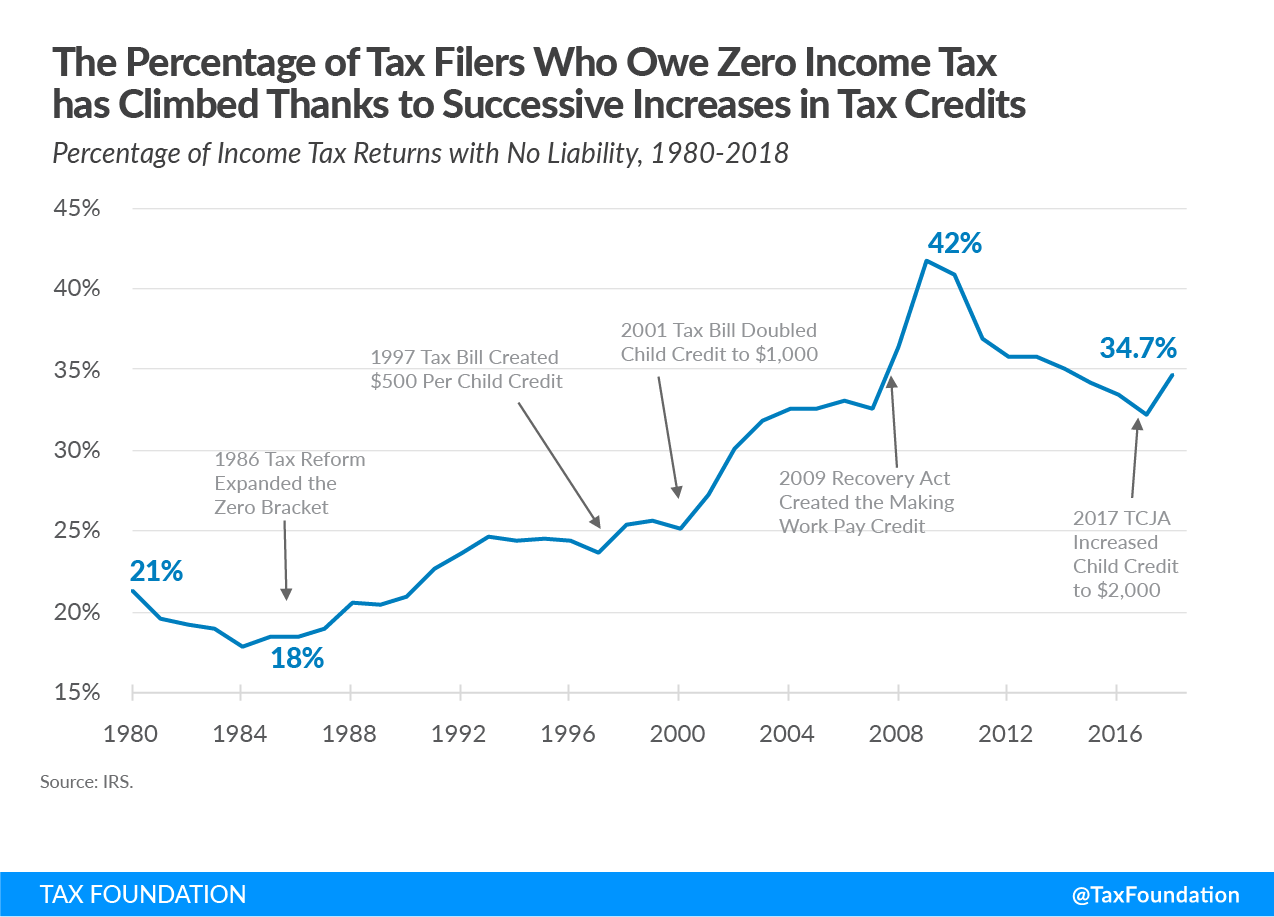
The percentage of filers with no liability spiked at 42 percent in 2009 with creation of the Making Work Pay tax credit. As the economy recovered from the Great Recession, the percentage of filers with no liability declined to 32 percent in 2017. The percentage has begun to spike again after the TCJA doubled the Child Tax Credit to $2,000 from $1,000. This increased the number of non-payers by more than 4 million, from 49.1 million to 53.3 million.
Many of these low-income taxpayers receive refundable tax credits, which means that they get a check back from the IRS even if they have no income tax liability.
The combination of deductions and refundable tax credits means many lower-income households face negative income tax rates. According to Congressional Budget Office (CBO) data for 2017, the lowest quintile faced a negative 10.9 percent income tax rate, and the second quintile faced a negative 1.0 percent income tax rate. We do not have CBO data for 2018, but we know that the Tax Cuts and Jobs Act reduced income taxes across all quintiles on average, so the negative rates for the bottom two quintiles should fall further and the middle quintile could dip into negative as well.
Of course, households face more than just the individual income tax, and many households in the bottom of the income distribution pay more in payroll taxes than in individual income taxes. According to the CBO, households across the income spectrum also bear the burden of corporate income taxes and excise taxes. The net effect is that households in the bottom quintile face just a 1.3 percent average federal tax rate, compared to 31.6 percent for the top 1 percent.
Our Fiscal System Redistributes $1.7 Trillion from the Rich to Everyone Else
A recent study by the Congressional Budget Office, The Distribution of Household Income, 2017,[3] provides an insight into the tax code’s progressivity and the redistributive effects of federal fiscal policy—both taxes and direct federal benefits. The report provides estimates of how much households in various income groups benefited in 2017 from social insurance programs (such as Social Security and Medicare) as well as means-tested transfer programs (such as Medicaid, SNAP, and Supplemental Security Income), and contrasts these benefits with estimates of how much these households paid in total federal taxes.
One way to understand how much households receive in direct federal benefits compared to how much they pay in total federal taxes is to create a ratio. In other words, we can calculate how much in direct federal benefits do they receive for every $1 in total federal taxes paid.
As we can see in Table 1, in 2017, households in the lowest quintile received $67.67 in direct federal benefits for every $1 they paid in federal taxes.[4] Households in the second quintile received $4.60 in benefits for every $1 of taxes they paid, while households in the middle quintile received $1.60 in total direct benefits for every $1 of taxes they paid.
By contrast, households in the fourth quintile received $0.71 in direct federal benefits for every $1 they paid in taxes while households in the highest quintile received just $0.15 in direct federal benefits for every $1 they paid in federal taxes. For households in the top 1 percent, their return on every $1 of federal taxes paid was just $0.02. These figures demonstrate how progressive tax and spending policies have become.
| 2017 Income Group | Ratio: Direct Benefits Received to Taxes Paid |
|---|---|
| Lowest Quintile | $67.67 |
| Second Quintile | $4.60 |
| Middle Quintile | $1.60 |
| Fourth Quintile | $0.71 |
| Highest Quintile | $0.15 |
| 81st to 90th Decile | $0.36 |
| 91st to 95th Decile | $0.22 |
| 96th to 99th Decile | $0.12 |
| Top 1% | $0.02 |
|
Source: Congressional Budget Office, The Distribution of Household Income, 2017, Oct. 2, 2020, www.cbo.gov/publication/56575. |
|
The Numbers Add Up to a Lot of Redistribution
Another way to look at the data is in the aggregate, which allows us to measure how much various income groups receive in direct government benefits relative to how much they pay in total federal taxes. This will give us a sense of how much federal fiscal policy acts to redistribute income from some groups of American households to other groups.
Figure 3 shows that households in the bottom three quintiles collectively receive more than $1 trillion more in direct government benefits than they paid in all federal taxes in 2017. In other words, 60 percent of American households receive more in benefits than they pay in federal taxes.
By contrast, we can see that households in the top 20 percent of households pay $1.7 trillion more in taxes than they receive in direct benefits, of which $728 billion came from households in the top 1 percent.
The CBO data indicates that redistribution reduced the incomes of households in the top 1 percent by more than one-third, while lifting the incomes of households in the lowest quintile by 126 percent, those in the second quintile by 46 percent, and those in the middle quintile by 10 percent. Those are the results that you would expect from a highly progressive fiscal system.

The Danger of Taxing Wealth—Enriching Foreign Billionaires
Some argue that one way of addressing inequality is taxing wealth on an annual basis. Tax Foundation economists modeled the impact of the wealth taxes proposed by Senators Warren and Sanders during the 2020 presidential campaign. These results will surprise many.
Our Taxes and Growth (TAG 2.0) General Equilibrium Tax Model determined that these wealth taxes would have a relatively modest impact on GDP, wages, and jobs but would have a big impact on who owns U.S. assets. Why is that? It turns out that the model determined that the wealth tax would force the wealthy to sell their assets to pay the tax, often at discount prices. Because the U.S. is an open economy and capital markets are global, the model indicated that foreign investors would purchase those assets, which is why GDP does not fall by much. But what this does mean is that the wealth tax would result in the transfer of ownership of those assets from wealthy Americans to wealthy foreigners.[5]
Thus, the unintended impact of a wealth tax is that it would transfer wealth from U.S. millionaires and billionaires to foreign billionaires and mean that American workers could increasingly be employed by foreign employers. Now owned by foreigners, these assets would be out of reach of the wealth tax.[6]
When You Tax Corporations You Get Less of Them
Now let’s look at the corporate side of the tax code.
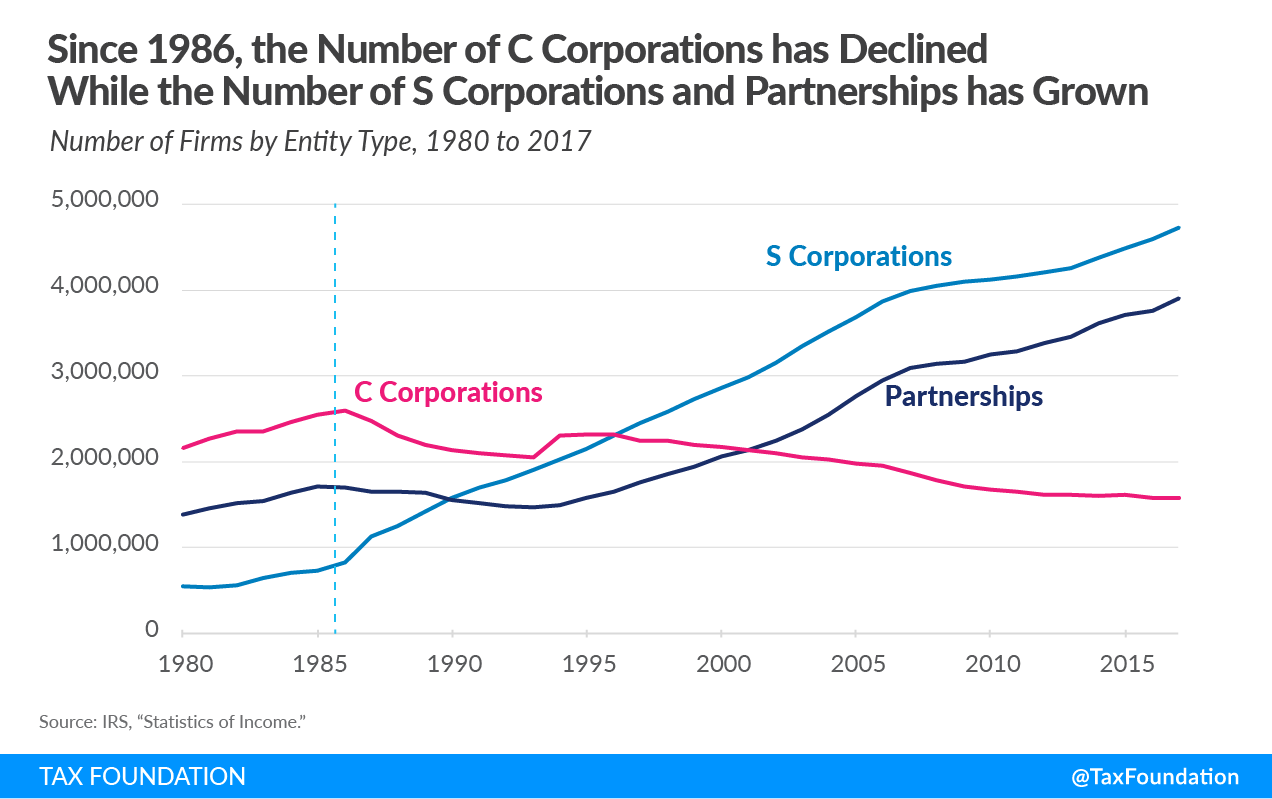
If the tax code were rigged in favor of corporations, we would have more of them. Today there are about 1.6 million corporations, the fewest number since 1974. C corps reached their zenith in 1986 and have been on the decline ever since. The U.S. now has 1 million fewer corporations today than it did more than three decades ago.
Perhaps one reason for this decline is the fact that the U.S. levied one of the highest corporate rates in the developed world for nearly a quarter-century, from 1993, when the rate was increased to 35 percent, until it was lowered to 21 percent in 2017. Throughout that entire period of having a globally high corporate tax rate, corporate tax collections averaged just 10 percent of federal revenues, or about 1.8 percent of GDP. Perhaps this proves the economic truism that when you tax more of something, you get less of it.
Instead, You Get More Pass Throughs and Perceptions of Rising Inequality
As the number of traditional C corporations has declined, the number of pass-through businesses has skyrocketed. As we can see in Figure 4, since 1986, the number of S corporations grew by more than fivefold, from about 826,000 to over 4.2 million. The number of partnerships did lag for a few years following 1986, but once the LLC form took off, the number climbed to roughly 3.4 million. Figure 4 does not include sole proprietorships, which grew from 12.4 million in 1986 to over 23 million today.[7]
The shift in business forms since 1986 has meant that more business income is now reported on individual 1040 tax forms than on traditional 1120 corporate forms. The explosion of pass-through business income is most notably seen on the tax returns of high-income taxpayers, which is contributing to the appearance of rising inequality.
In Figure 5 below, we can see the changing composition of income for the top 1 percent of taxpayers from 1950 to 2017. The data is drawn from the website of University of Berkeley economist Emmanuel Saez. Focus on the line tracking the composition of what Saez calls “entrepreneurial income,” or pass-through income, because this line largely traces what he and Gabriel Zucman have identified as the trend in inequality since 1950.
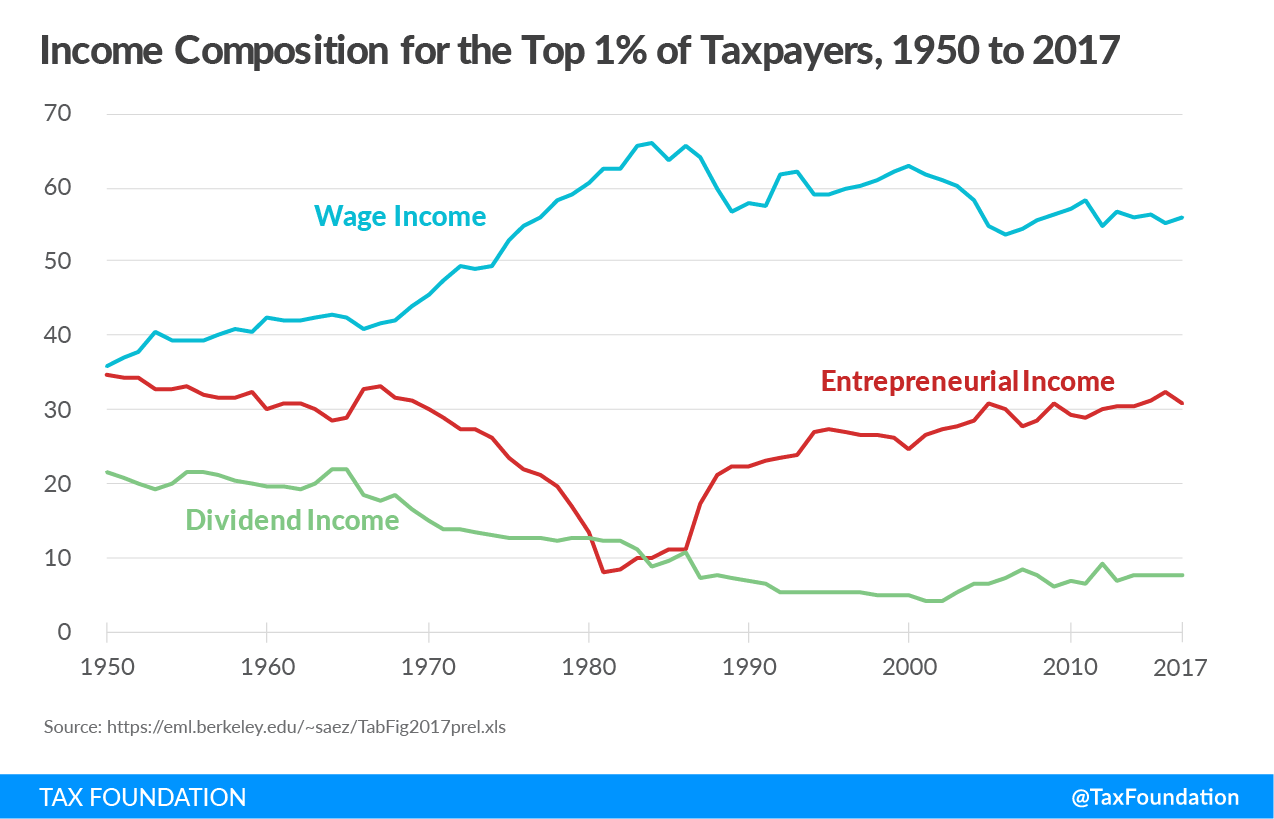
Saez and Zucman have argued that we should return to the high individual tax rates that were levied from 1950 through 1980 because they had the effect of reducing inequality. Inequality began to rise again, they argue, as top marginal tax rates began to fall following the 1981 tax cuts. But, as we can see, the high marginal tax rates prior to 1980 largely drove entrepreneurial business income off the individual income tax forms of the top 1 percent of taxpayers onto corporate returns. Corporate net income rose throughout this period as the wealthy’s “entrepreneurial income” declined. The pattern suggests that the wealthy’s “entrepreneurial income” was being reported on traditional corporate tax forms, not individual tax forms.
There were certainly rich people during those early decades as there are today, but many high earners simply sheltered their income in traditional C corporations, which faced considerably lower tax rates relative to personal income tax rates. This gave the appearance that there were fewer rich people than there actually were. This phenomenon reversed itself during the 1980s when the top individual income tax rate fell below the corporate rate and the restrictions on the structure and participation in partnerships and S corporations eased.
We can see on Figure 5 that the amount and share of pass-through business income on the tax returns of the top 1 percent of taxpayers has soared since the 1980s. Income that historically would have been reported on a corporate 1120 tax form is now being reported on individual 1040 tax forms, contributing to the appearance of rising inequality.
U.S. Tax System Is Most “Business Dependent”
Setting aside the debate over whether a low tax bill is fair, what is missed in such discussions is that American businesses are critical to the tax collection system at every level of government—federal, state, and local. In 2017, OECD economist Anna Milanez measured the amount of taxes that businesses in 24 countries contributed to the overall tax collection system. Her report determined that the U.S. was one of the most “business dependent” tax systems in the industrialized world.[8]
The report found that U.S. businesses either pay or remit more than 93 percent of all the taxes collected by governments in the U.S.[9] As Figure 6 shows, this includes taxes paid directly by businesses, such as corporate income taxes, property taxes, and excises taxes, as well as the taxes businesses remit on behalf of employees and customers, such as payroll taxes, withholding taxes, and sales taxes.

Without businesses as their taxpayers and tax collectors, or significantly altering the tax system, American governments would not have the resources to provide even the most basic services. Considering the role of businesses in collecting the taxes needed to support the functions of our government, one would be hard-pressed to say that the system is rigged in their favor.
The Corporate Tax Is the Most Harmful for Economic Growth
A seminal study by economists at the OECD ranked the major taxes in terms of their harm to economic growth.[10] Corporate income taxes were found to be the most harmful for growth, followed, in order, by personal income taxes, consumption taxes, and property taxes.
The reason corporate income taxes were determined to be most harmful for growth is because capital is the most mobile factor in the economy and, thus, the most sensitive to high tax rates. People and the things we own are less mobile and, thus, less sensitive to high tax rates. This is not to say that these factors are insensitive to taxation, just less so than taxes on capital.
Tax Foundation economists used our Taxes and Growth (TAG 2.0) General Equilibrium Tax Model to measure the economic impact of raising the corporate tax rate to 28 percent.[11] The model determined that such a rate increase would reduce long-run GDP by 0.8 percent, eliminate 159,000 jobs, and reduce wages by 0.7 percent.
| Raise Corporate Income Tax Rate to 25 Percent | Raise Corporate Income Tax Rate to 28 Percent | |
|---|---|---|
| GDP | -0.4% | -0.8% |
| GNP | -0.4% | -0.8% |
| Capital Stock | -1.1% | -2.1% |
| Wage Rate | -0.4% | -0.7% |
| Full-Time Equivalent Jobs | -84,200 | -159,000 |
|
Source: Tax Foundation General Equilibrium Model, January 2021. |
||
The model also determined that even a less dramatic increase in the corporate rate to 25 percent would still dampen economic growth. It found that a 25 percent rate would reduce GDP by 0.4 percent, lower the capital stock by 1.1 percent, and eliminate over 84,000 jobs.
Workers (Often Women and Low-Skilled) Bear the Burden of Corporate Taxes
A growing body of academic research is indicating that in our global economy, where capital is mobile, but workers are not, workers are bearing a greater and greater share of the economic burden of corporate taxes.[12] One recent study found that workers bear 51 percent of the economic burden of corporate income taxes through reduced wages, especially for “the low-skilled, women, and young workers.”[13]
The TAG Model’s analysis of raising the corporate tax rate to 28 percent shows that its impact is not isolated to high-income taxpayers, who tend to be the owners of capital. As Table 3 indicates, on a conventional basis, raising the corporate tax rate to 28 percent would reduce the after-tax incomes of the top 1 percent of earners by 1.5 percent in 2022, far higher than any other group. However, because workers bear some portion of the corporate tax, low-income workers would see their after-tax incomes fall by 0.5 percent, while middle-income workers would see their incomes fall by 0.4 percent.
Those effects are in the short run. In the long run, after the model factors in all of the economic effects of the tax increase, it finds that high-income taxpayers would still see the largest reduction in after-tax incomes at 3.2 percent. However, we can also see that over the long run, the bottom 20 percent of earners would watch their incomes fall by 1.5 percent, three times larger than the conventional estimate. Similarly, middle-income earners would see their incomes fall by 1.4 percent over time.
| Income Quintile | Conventional, 2022 | Conventional, 2031 | Dynamic, Long-Run |
|---|---|---|---|
| 0% to 20% | -0.5% | -0.6% | -1.5% |
| 20% to 40% | -0.4% | -0.5% | -1.3% |
| 40% to 60% | -0.4% | -0.5% | -1.4% |
| 60% to 80% | -0.5% | -0.5% | -1.4% |
| 80% to 100% | -0.9% | -1.0% | -2.1% |
| 80% to 90% | -0.5% | -0.6% | -1.4% |
| 90% to 95% | -0.6% | -0.7% | -1.6% |
| 95% to 99% | -0.8% | -0.9% | -1.9% |
| 99% to 100% | -1.5% | -1.8% | -3.2% |
| TOTAL | -0.7% | -0.8% | -1.8% |
|
Source: Tax Foundation General Equilibrium Model, January 2021. |
|||
Competitiveness Matters
Since the corporate income tax is the most harmful tax for economic growth, it is critically important that the federal corporate tax rate not be increased above its current 21 percent level. While some have criticized the drop from 35 percent as too big of a reduction, the rate cut lowered the U.S. standing from the highest among the 37 OECD nations, to 12th highest when we include the average of state corporate tax rates. This is hardly a “race to the bottom” as some have suggested.
The combined federal-state corporate tax rate currently stands at 25.8 percent, compared to a simple average of OECD countries (excluding the U.S.) of 23.4 percent, and a weighted average of 26.5 percent. In other words, the combined U.S. corporate tax rate is barely average among our global trading partners. Again, hardly a race to the bottom.
However, if the federal rate were to be increased to 28 percent, the combined U.S. rate would jump to 32.3 percent, once again highest among OECD nations. Countries such as France and Sweden, which are in the process of cutting their corporate tax rates, would love for the U.S. to raise its corporate tax rate because it would instantly make them more attractive for investment and jobs. As concerning, China’s rate is 25 percent, so we also risk losing competitiveness with our fiercest economic competitor by raising our corporate tax rate.
While the Tax Cuts and Jobs Act removed our outlier status regarding our corporate tax rate, it gave us a new outlier status with the creation of a complex set of new international tax rules. This is especially true of the minimum tax levied on Global Intangible Low-Tax Income (GILTI), which stands out as unique among other nation’s tax systems.
To be fair, GILTI has seemingly eliminated much of the “nowhere income” that generated libraries of academic studies about corporate tax avoidance. Another new international rule, the Foreign Intangible Domestic Income (FDII), has also incentivized many companies to bring their intellectual property back to the U.S. And we should acknowledge that the new exemption regime, or “territorial” system, has eliminated corporate inversions as U.S. firms can repatriate their foreign earnings without paying an additional toll charge.
While GILTI has eliminated the nowhere foreign income of U.S. multinationals, an arcane provision in GILTI is being criticized for somehow incentivizing companies to invest abroad rather than in the U.S. The GILTI tax base excludes profits that amount to a 10 percent return on tangible foreign assets. This is called the “QBAI” deduction, for Qualified Business Asset Investment.
The original purpose of QBAI was to be a proxy for determining super-normal returns from foreign investments but has become a mirage in the tax code for those who believe it leads to outsourcing. On closer inspection, there is no evidence of this. On the contrary, studies show that the new international tax rules did not reduce the effective tax rate on foreign income for U.S. multinationals.[14] Indeed, when the Joint Committee on Taxation scored the international provisions of the TCJA, they found them to be a net tax increase of $112 billion over 10 years. This indicates that the base on international income is much broader than prior to the TCJA.
Conclusion
Digging through the data, it is difficult to find evidence that the U.S. tax code is rigged in favor of the rich and corporations. The wealthy’s share of the income tax burden has never been higher, redistribution from them has never been greater, and more than 53 million low- and middle-income Americans pay no income taxes because of the generous credits and deductions benefiting them.
Moreover, the 21 percent U.S. corporate tax rate is now average among our peers, but the number of corporations is at a 50-year low after decades of levying one of the highest corporate tax rates in the developed world. Raising the corporate rate to 28 percent would likely accelerate this trend and spur more companies to either become pass throughs or move their headquarters to friendlier tax climates.
We ought to be worried about the impact of corporate taxes on women, low-skilled workers, and younger workers, since they are the very workers who have been most impacted by the COVID-19 crisis. Raising the corporate tax rate would simply hurt them even more.
Addressing income inequality by expanding tax credits is palliative; it does nothing to raise real incomes and long-term living standards of working people. A better way is to focus on permanent tax policies that promote increased productivity, more jobs, higher real wages, and real economic growth.
Isn’t that the kind of inclusive growth that all of us could support?
Thank you for your time and attention.
[1] Organisation for Economic Co-operation and Development, “Growing Unequal? Income Distribution and Poverty in OECD Countries,” Oct. 21, 2008, 104-107, https://www.doi.org/10.1787/9789264044197-en.
[2] Erica York, “Summary of the Latest Federal Income Tax Data, 2021 Update,” Tax Foundation, Feb. 3, 2021, https://www.taxfoundation.org/federal-income-tax-data-2021/.
[3] Congressional Budget Office, The Distribution of Household Income, 2017, Oct. 2, 2020, https://www.cbo.gov/publication/56575.
[4] Scott A. Hodge, “Latest CBO Report on Incomes and Taxes Shows that the Federal Fiscal System is Very Progressive,” Tax Foundation, Jan. 26, 2021, https://www.taxfoundation.org/biden-fiscal-policy/#:~:text=Conclusion,is%20very%20progressive%20and%20redistributive.
[5] Huaqun Li and Karl Smith, “Analysis of Sen. Warren and Sen. Sanders’ Wealth Tax Plans,” Tax Foundation, Jan. 28, 2020, https://www.taxfoundation.org/wealth-tax/.
[6] Scott A. Hodge, “Warren’s Wealth Tax Enriches Foreign Billionaires,” The Wall Street Journal, Mar. 8, 2021. https://www.wsj.com/articles/warrens-wealth-tax-enriches-foreign-billionaires-11615227317.
[7] Scott A. Hodge, “The Real Lesson of 70 Percent Tax Rates on Entrepreneurial Income,” Tax Foundation, Jan. 29, 2019, 5, https://www.taxfoundation.org/70-tax-rate-entrepreneurial-income/.
[8] Anna Milanez, “Legal Tax Liability, Legal Remittance Responsibility and Tax Incidence: Three Dimensions of Business Taxation,” OECD Taxation Working Papers No. 32, Sept. 18, 2017, 32, https://www.oecd-ilibrary.org/taxation/legal-tax-liability-legal-remittance-responsibility-and-tax-incidence_e7ced3ea-en. For more detail on the Milanez study, see Scott A. Hodge, “Contrary to ‘Fair Share’ Claims, Businesses are Central to Tax Collection Systems,” Tax Foundation, May 16, 2018, https://www.taxfoundation.org/fair-share-businesses-central-to-tax-collections/.
[9] Scott A. Hodge, “U.S. Businesses Pay or Remit 93 Percent of All Taxes Collected in America,” Tax Foundation, May 2, 2019, https://www.taxfoundation.org/businesses-pay-remit-93-percent-of-taxes-in-america/.
[10] OECD, Tax Policy Reform and Economic Growth, OECD Tax Policy Studies, No. 20, Nov. 3, 2010, https://www.doi.org/10.1787/9789264091085-en.
[11] Garrett Watson and William McBride, “Evaluating Proposals to Increase the Corporate Tax Rate and Levy a Minimum Tax on Corporate Book Income,” Tax Foundation, Feb. 24, 2021, https://www.taxfoundation.org/biden-corporate-income-tax-rate/.
[12] Stephen J. Entin, “Labor Bears Much of the Cost of the Corporate Tax,” Tax Foundation, Oct. 24, 2017, https://www.taxfoundation.org/labor-bears-corporate-tax/. Studies appear to show that labor bears between 50 percent and 100 percent of the burden of the corporate income tax.
[13] Clemens Fuest, Andreas Peichl, and Sebastian Siegloch, “Do Higher Corporate Taxes Reduce Wages? Micro Evidence from Germany,” American Economic Review 108:2 (February 2018): 393–418, https://www.doi.org/10.1257/aer.20130570.
[14] Scott Dyreng, Fabio B. Gaertner, Jeffrey L. Hoopes, and Mary Vernon, “The Effect of U.S. Tax Reform on the Tax Burdens of U.S. Domestic and Multinational Corporations,” June 5, 2020, https://www.papers.ssrn.com/sol3/papers.cfm?abstract_id=3620102.
Original Article Posted at : https://taxfoundation.org/rich-pay-their-fair-share-of-taxes/