
Ranking Individual Income Taxes on the 2021 State Business Tax Climate Index
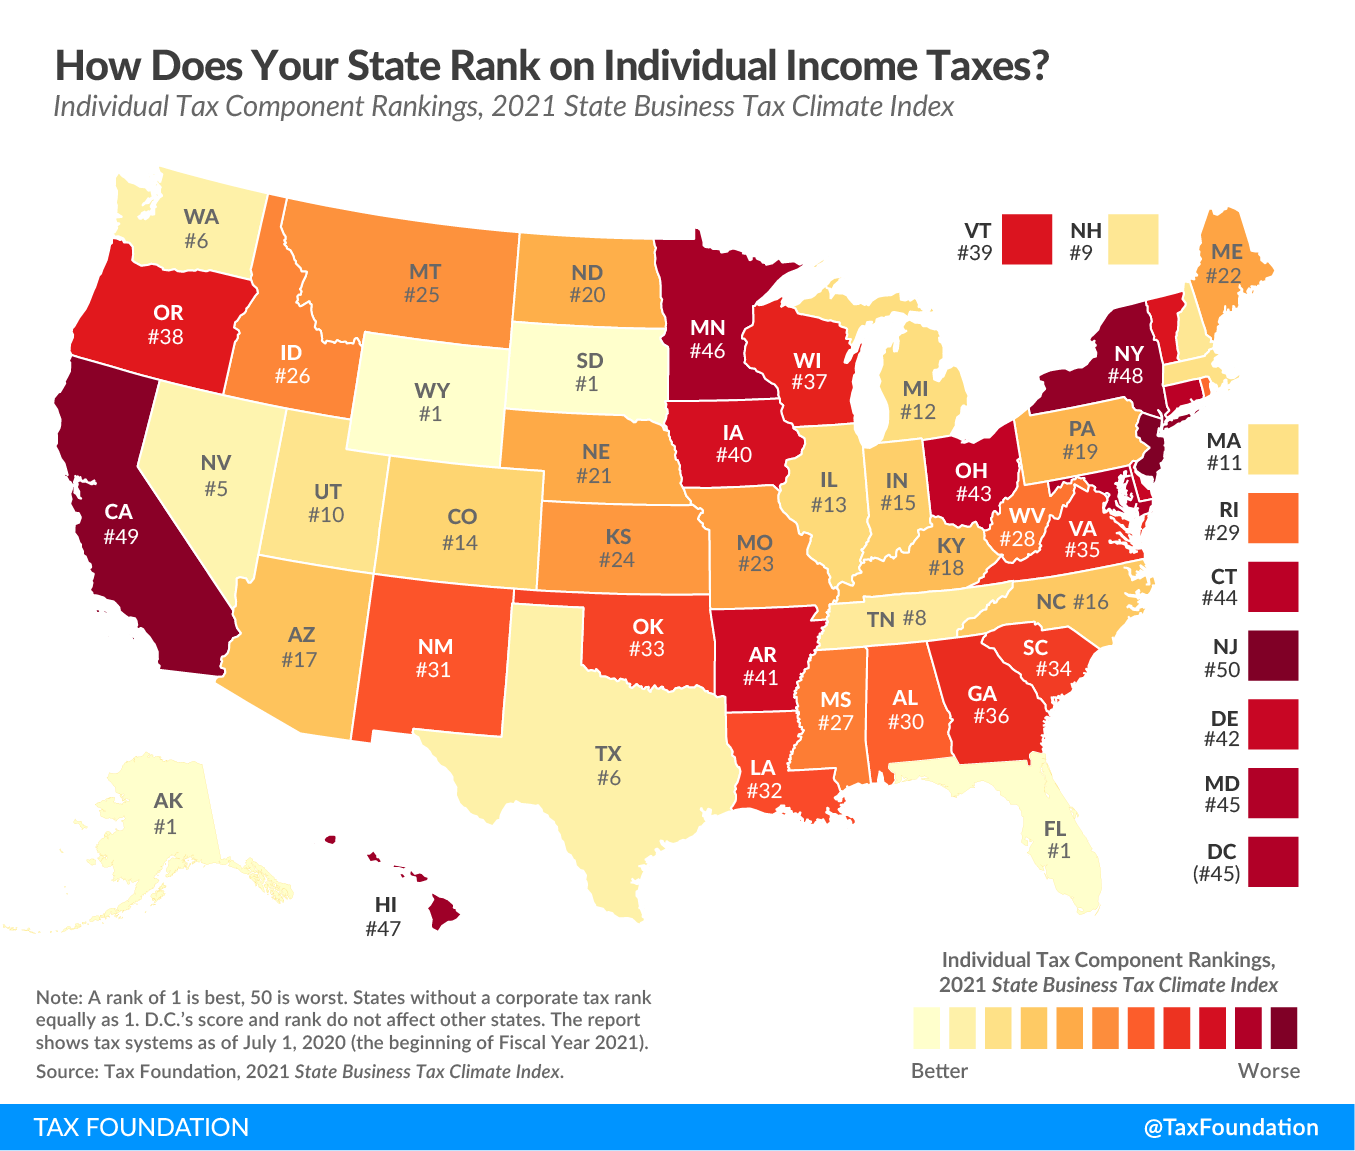
This week’s map examines states’ rankings on the individual income tax component of the 2021 State Business Tax Climate Index. The individual income tax is important to businesses because states tax sole proprietorships, partnerships, and in most cases limited liability companies (LLCs) and S corporations under the individual income tax code. However, even traditional C corporations are indirectly impacted by the individual income tax, as this tax influences the location decisions of individuals, potentially impacting the state’s labor supply. States with gross receipts taxes also extend those to pass-through businesses in addition to C corporations, which are also accounted for in this component of the Index.
States that score well on the Index’s individual income tax component usually have a flat, low-rate income tax with few deductions and exemptions. They also tend to protect married taxpayers from being taxed more heavily when filing jointly than they would be when filing as two single individuals. In addition, states perform better on the Index’s individual income tax component if they index their brackets, deductions, and exemptions for inflation, which avoids unlegislated tax increases.
States with a perfect score on the individual income tax component (Alaska, Florida, South Dakota, and Wyoming) have no individual income tax and no payroll taxes besides the unemployment insurance tax. The next highest-scoring states are Nevada, Texas, Washington, Tennessee, and New Hampshire. Nevada taxes wage income at a low rate under the state’s Modified Business Tax but does not tax investment income. Tennessee and New Hampshire tax interest and dividend income but not wage income. Texas and Washington do not tax wage income but don’t receive a perfect score on this component because they apply their gross receipts taxes to LLCs and S corporations, which, in most states, would be taxed under individual income tax codes. Other states that score well on the individual income tax component are Colorado, Illinois, Indiana, Kentucky, Massachusetts, Michigan, North Carolina, and Utah, because they all have a single low tax rate.
States that score poorly on this component tend to have high tax rates and very progressive bracket structures. They generally fail to index their brackets, exemptions, and deductions for inflation, do not allow the deduction of foreign or other state taxes, penalize married couples filing jointly, do not include LLCs and S corporations under the individual income tax code (instead taxing them as C corporations), and may impose an alternative minimum tax (AMT). The poorest-performing states on this year’s individual income tax component are New Jersey, California, New York, Hawaii, and Minnesota.
Click here to see an interactive version of states’ individual income tax rankings, and then click on your state for more information about how its tax system compares regionally and nationally.
To see whether your state’s individual income tax structure has moved up or down in the ranks in recent years, check out the table below.
| 2021 | 2020 | 2020-2021 Change | Prior Year Ranks | |||||||||
|---|---|---|---|---|---|---|---|---|---|---|---|---|
| State | Rank | Score | Rank | Score | Rank | Score | 2019 | 2018 | 2017 | 2016 | 2015 | 2014 |
|
Alabama |
30 | 4.81 | 30 | 4.82 | 0 | -0.01 | 30 | 28 | 28 | 27 | 28 | 25 |
|
Alaska |
1 | 10.00 | 1 | 10.00 | 0 | 0.00 | 1 | 1 | 1 | 1 | 1 | 1 |
|
Arizona |
17 | 5.49 | 17 | 5.51 | 0 | -0.02 | 19 | 18 | 18 | 18 | 20 | 19 |
|
Arkansas |
41 | 4.18 | 40 | 4.07 | -1 | 0.11 | 40 | 39 | 39 | 36 | 31 | 29 |
|
California |
49 | 2.53 | 49 | 2.54 | 0 | -0.01 | 49 | 50 | 50 | 50 | 50 | 50 |
|
Colorado |
14 | 5.84 | 14 | 5.85 | 0 | -0.02 | 14 | 16 | 16 | 16 | 16 | 15 |
|
Connecticut |
44 | 3.87 | 43 | 3.88 | -1 | -0.01 | 43 | 46 | 46 | 46 | 40 | 40 |
|
Delaware |
42 | 4.05 | 41 | 4.06 | -1 | -0.01 | 41 | 43 | 43 | 41 | 42 | 43 |
|
Florida |
1 | 10.00 | 1 | 10.00 | 0 | 0.00 | 1 | 1 | 1 | 1 | 1 | 1 |
|
Georgia |
36 | 4.56 | 36 | 4.53 | 0 | 0.03 | 38 | 36 | 36 | 37 | 37 | 35 |
|
Hawaii |
47 | 3.51 | 47 | 3.52 | 0 | -0.01 | 47 | 37 | 37 | 45 | 46 | 46 |
|
Idaho |
26 | 5.01 | 26 | 5.03 | 0 | -0.01 | 24 | 21 | 21 | 21 | 22 | 21 |
|
Illinois |
13 | 5.85 | 13 | 5.87 | 0 | -0.02 | 13 | 15 | 12 | 12 | 15 | 11 |
|
Indiana |
15 | 5.77 | 15 | 5.74 | 0 | 0.03 | 15 | 10 | 10 | 10 | 10 | 10 |
|
Iowa |
40 | 4.29 | 42 | 4.03 | 2 | 0.26 | 42 | 40 | 40 | 39 | 39 | 39 |
|
Kansas |
24 | 5.07 | 23 | 5.09 | -1 | -0.01 | 22 | 19 | 19 | 19 | 18 | 17 |
|
Kentucky |
18 | 5.47 | 18 | 5.47 | 0 | 0.01 | 17 | 35 | 35 | 35 | 36 | 34 |
|
Louisiana |
32 | 4.71 | 32 | 4.73 | 0 | -0.01 | 32 | 33 | 33 | 32 | 34 | 32 |
|
Maine |
22 | 5.13 | 22 | 5.14 | 0 | -0.02 | 25 | 26 | 24 | 28 | 21 | 20 |
|
Maryland |
45 | 3.64 | 45 | 3.67 | 0 | -0.04 | 45 | 45 | 45 | 43 | 44 | 44 |
|
Massachusetts |
11 | 5.94 | 11 | 5.96 | 0 | -0.02 | 11 | 12 | 13 | 13 | 12 | 13 |
|
Michigan |
12 | 5.93 | 12 | 5.95 | 0 | -0.02 | 12 | 14 | 14 | 14 | 13 | 14 |
|
Minnesota |
46 | 3.59 | 46 | 3.61 | 0 | -0.01 | 46 | 44 | 44 | 44 | 45 | 45 |
|
Mississippi |
27 | 4.89 | 27 | 4.90 | 0 | -0.01 | 27 | 24 | 25 | 25 | 25 | 23 |
|
Missouri |
23 | 5.10 | 24 | 5.07 | 1 | 0.03 | 26 | 31 | 32 | 30 | 30 | 28 |
|
Montana |
25 | 5.02 | 25 | 5.03 | 0 | -0.01 | 23 | 20 | 20 | 20 | 19 | 18 |
|
Nebraska |
21 | 5.15 | 21 | 5.16 | 0 | -0.01 | 21 | 22 | 22 | 22 | 23 | 37 |
|
Nevada |
5 | 8.40 | 5 | 8.43 | 0 | -0.02 | 5 | 1 | 1 | 1 | 1 | 1 |
|
New Hampshire |
9 | 6.37 | 9 | 6.39 | 0 | -0.02 | 9 | 9 | 9 | 9 | 9 | 9 |
|
New Jersey |
50 | 1.86 | 50 | 1.86 | 0 | -0.01 | 50 | 48 | 48 | 48 | 48 | 48 |
|
New Mexico |
31 | 4.80 | 31 | 4.81 | 0 | -0.01 | 31 | 27 | 27 | 26 | 27 | 24 |
|
New York |
48 | 3.05 | 48 | 3.06 | 0 | -0.01 | 48 | 49 | 49 | 49 | 49 | 49 |
|
North Carolina |
16 | 5.71 | 16 | 5.73 | 0 | -0.02 | 16 | 13 | 15 | 15 | 14 | 38 |
|
North Dakota |
20 | 5.23 | 20 | 5.24 | 0 | -0.02 | 20 | 23 | 23 | 23 | 26 | 27 |
|
Ohio |
43 | 3.96 | 44 | 3.86 | 1 | 0.10 | 44 | 47 | 47 | 47 | 47 | 47 |
|
Oklahoma |
33 | 4.64 | 33 | 4.66 | 0 | -0.01 | 33 | 32 | 30 | 33 | 33 | 31 |
|
Oregon |
38 | 4.42 | 38 | 4.43 | 0 | -0.01 | 36 | 38 | 38 | 38 | 38 | 36 |
|
Pennsylvania |
19 | 5.41 | 19 | 5.38 | 0 | 0.03 | 18 | 17 | 17 | 17 | 17 | 16 |
|
Rhode Island |
29 | 4.86 | 29 | 4.88 | 0 | -0.01 | 29 | 29 | 29 | 29 | 29 | 26 |
|
South Carolina |
34 | 4.62 | 34 | 4.63 | 0 | -0.01 | 34 | 30 | 31 | 31 | 32 | 30 |
|
South Dakota |
1 | 10.00 | 1 | 10.00 | 0 | 0.00 | 1 | 1 | 1 | 1 | 1 | 1 |
|
Tennessee |
8 | 7.07 | 8 | 7.09 | 0 | -0.02 | 8 | 8 | 8 | 8 | 8 | 8 |
|
Texas |
6 | 7.88 | 6 | 7.90 | 0 | -0.02 | 6 | 6 | 6 | 6 | 6 | 6 |
|
Utah |
10 | 6.08 | 10 | 6.10 | 0 | -0.02 | 10 | 11 | 11 | 11 | 11 | 12 |
|
Vermont |
39 | 4.36 | 39 | 4.37 | 0 | -0.01 | 37 | 42 | 42 | 42 | 43 | 42 |
|
Virginia |
35 | 4.60 | 35 | 4.62 | 0 | -0.01 | 35 | 34 | 34 | 34 | 35 | 33 |
|
Washington |
6 | 7.88 | 6 | 7.90 | 0 | -0.02 | 6 | 6 | 6 | 6 | 6 | 6 |
|
West Virginia |
28 | 4.88 | 28 | 4.90 | 0 | -0.01 | 28 | 25 | 26 | 24 | 24 | 22 |
|
Wisconsin |
37 | 4.50 | 37 | 4.51 | 0 | -0.01 | 39 | 41 | 41 | 40 | 41 | 41 |
|
Wyoming |
1 | 10.00 | 1 | 10.00 | 0 | 0.00 | 1 | 1 | 1 | 1 | 1 | 1 |
|
District of Columbia |
45 | 3.67 | 45 | 3.68 | 0 | -0.01 | 45 | 48 | 48 | 43 | 45 | 45 |
|
Note: A rank of 1 is best, 50 is worst. All scores are for fiscal years. DC’s score and rank do not affect other states. Source: Tax Foundation. |
||||||||||||
Original Article Posted at : https://taxfoundation.org/best-worst-state-income-tax-codes-2021/